by Xiaopei Lin
The eastern subpolar North Atlantic has a special role in the Atlantic Overturning Circulation (AMOC) and global climate change. The waters in this regions are subtropical-origin warm and salty water masses, which are carried by the North Atlantic Current. They either move further northward into the Nordic Seas or cyclonically circulate to the Irminger Sea and Labrador Sea and then transform into dense waters. Substantial heat is released along their pathways, which is pivotal to maintaining a relatively warm climate in Northern Europe.
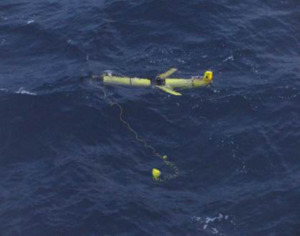
As a component of the Overturning in the Subpolar North Atlantic Program (OSNAP), WHOI-OUC jointly deployed gliders (underwater autonomous vehicles) in the Iceland Basin. The Iceland Basin lies east of the Reykjanes Ridge and west of the Rockall Plateau. The battery in each glider can afford continuous scientific sampling up to 6 months. Therefore, a new mission needs be triggered every half year. This is very challenging because it is not easy to find suitable ships, especially in winter, to recover and deploy vehicles. We had to rent small boats in Iceland and launch gliders near the coast. The glider section is about 260 nautical miles (more than 425 km) south of Iceland. With an averaged horizontal fly ing speed of 0.2 m/s, the glider takes three to four weeks to navigate to the working site. If the glider needs to swim back to the coast, the vehicle had to stop scientific samplings one month before the battery run out. In other words, about one third (two months over 6 months) of energy will be spent on the non-scientific task!
Despite the various logistics we have to deal with, 6 glider missions have been successfully completed between June 2015 and December 2017. More than 3000 hydrographic profiles have been collected. Moving at approximately 0.2 m/s, gliders ‘fly’ through the ocean from surface to 1000 m. In each dive-climb cycle, they navigate along a sawtooth trajectory and measure temperature, conductivity (salinity), pressure and oxygen. The horizontal sample-spacing averages 3 km, but near the surface and 1000-m turnaround points distance ranges from hundreds of meters to 6 km. The surveyed section is along 58°N with endpoints at 24.5°W and 21°W, respectively. The section is about 200 km in length and a one-way transect is usually completed in 7–10 days.

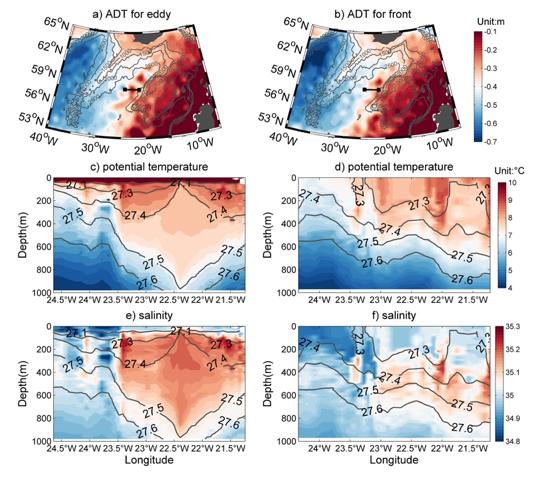
Hydrographic properties in the Iceland Basin for mesoscale eddy and frontal circulation patterns near 58°N. The left panels show the ocean state on 3 -13 August, 2015, for absolute dynamic topography (a), glider potential temperature (c), and glider salinity (e). The corresponding ocean state on 14-20 December 2016 is displayed in the right panels (b, absolute dynamic topography; d, potential temperature; f, salinity). Glider transect is marked by black lines in a) and b). The isobaths in panel a) and b) are represented by gray lines. The gray contour lines from panel c) to f) display the relative potential density.
The In-situ observations indicate two circulation regimes in the Iceland Basin: a mesoscale eddy like pattern and northward flowing NAC pattern. When a mesoscale eddy is generated, the rotational currents associated with the eddy lead to both northward and southward flow in the Iceland basin. This is quite different from the broad northward flow associated with the NAC when there is no eddy. The transition between the two regimes coupled with the strong temperature front in the Iceland basin can modify the meridional temperature flux on the order of 0.3PW. The dramatic variability induced by alternating eddy and frontal patterns is also found in high-resolution (1/12°) HYCOM simulations. In addition, a separation of large scale and mesoscale processes in the model results suggests that eddies in the Iceland Basin make significant contributions to the variability of the total basinwide poleward heat flux on time scales from subseasonal to interannual.
Detailed examinations of satellite altimetry data suggest that the alternative occurrence of eddy and front are quite common in the Iceland Basin. Therefore, the observed two circulation regimes detected from glider data are generally representative of long-term conditions. The velocity change associated with the eddy and front scenarios contribute to high Eddy Kinetic Energy (EKE). The surface EKE from altimetry data suggest that enhanced EKE is located in the eastern part of the subpolar region, especially in the Iceland Basin and Rockall Trough, coincident with the branches of the NAC. Similar EKE map is also reproduced by the eddy-resolving (1/12°) HYCOM simulations. In addition, the model results reveal that EKE along the OSNAP East line has nice correspondence with the meridional heat transport variability, with the highest values located in the Iceland Basin. As a result, the eddy and front structures captured by the gliders are the dominant processes to generate the temperature transport variability in the Iceland Basin.

a) Mean surface Eddy Kinetic Energy (EKE) from 1993 to 2015 from the satellite data. Unit: m^2/s^2. Magenta dash line represents the OSNAP East. Black diamonds denote the end points for the glider transect. The isobaths are illustrated by white contour lines.
b) Standard deviation of the meridional heat transport at each longitude in numerical simulations (red). The mean surface geostrophic EKE from altimeter observations (1992-2015) and numerical model (1992-2014) are displayed in blue and black, respectively. The vertical black dashed lines mark the endpoints of the glider transect, where the meridional heat transport has largest variability.
The results from the glider observations provide a fresh perspective on the dynamics responsible for the poleward heat transport in the subpolar North Atlantic Ocean, revealing that the alternating eddy and front patterns contributes significantly to the total poleward heat transport variability on time scales from subseasonal to interannual. This is different from our understanding about the mechanisms for oceanic heat transport variability, where large-scale circulation changes are believed to be the main driver. Our results emphasize the importance of resolving mesoscale processes in observations and numerical simulations to realistically capture their roles in modulating heat transport variability in the northern North Atlantic. High-resolution observational arrays capable of capturing both large scale and mesoscale variability, such as the OSNAP observing system (which includes moorings, gliders, Argo floats and satellite altimetry), are needed to measure the basinwide ocean MHT in the subpolar North Atlantic.
—
Results were recently published in Nature Communications:
Zhao, J., A. Bower, J. Yang, and X. Lin, 2018. Meridional heat transport variability induced by mesoscale processes in the subpolar North Atlantic. Nature Communications, 9, 1124, doi: 10.1038/s41467-018-03134-x
https://www.nature.com/articles/s41467-018-03134-x