As revealed by the first 21-month record (2014-2016) from the OSNAP array [Lozier et al. 2019], the subpolar overturning occurs primarily in the eastern subpolar region of the North Atlantic Ocean. This finding contrasts the view of Labrador Sea variability dominating the overturning circulation variability across a range of latitudes via the southward propagation of density anomalies formed by convection in the basin interior. The small overturning in the Labrador Sea was surprising since there was strong convection in the Labrador Sea during the 2014-2016 winters. However, given the scale of the expected delay in the overturning response, the 2014-2016 time series may have been too short to pick up this response. In short, the signals in the Labrador Sea may take a few years to imprint on the OSNAP array.
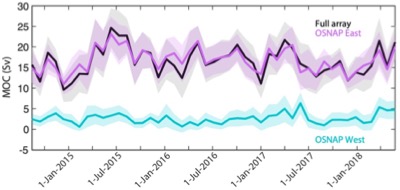
Continuous observations from the OSNAP array are now available for a 4-year period. The 4-year time series (2014-2018) of the estimated overturning across the section is shown in the figure below. Here the strength of the overturning circulation is defined as the maximum of the streamfunction in density coordinates, and is estimated across the full array, OSNAP West (Labrador Sea) and East (eastern subpolar gyre between Greenland and Scotland), separately. As shown in Lozier et al. [2019], this decomposition allows us to make relative comparisons of the overturning contributions within the subpolar subbasins. Clearly, there is a consistent pattern throughout the records: the overturning circulation takes place primarily across the OSNAP East section in the eastern subpolar region. The extended time series proves the validity of the first 21-month record and supports a diminish contribution from the Labrador Sea, over the observational time scales.

30-day time series of the strength of the meridional overturning circulation (MOC) across the full OSNAP array, and the OSNAP East and West sections, separately. Shading indicates the uncertainty in each 30-day estimate, obtained from Monte Carlo simulations. The 4-year mean MOC is 16.6 Sv# (uncertainty of 0.7 Sv; standard deviation of 3.5 Sv) across the full array, 16.8 Sv (uncertainty of 0.6 Sv; standard deviation of 2.8 Sv) across OSNAP East, and 2.6 Sv (uncertainty of 0.3 Sv; standard deviation of 1.2 Sv) across OSNAP West. # 1 Sv= 106 m3 s-1
Further analysis has been performed to assess the role of Labrador Sea and Irminger Sea convection in creating western boundary density anomalies in the region and the contributions of those boundary anomalies to the subpolar overturning variability [Li et al. 2020]. Results from this analysis shed light on the causes of North Atlantic overturning variability downstream from the subpolar region.
Of course, a question remains as to which subpolar basin(s) holds the key to the overturning variability over interannual and longer time scales. Needless to say, maintaining high-quality trans-basin observations is critical for tackling this question.
Finally, we are pleased to announce that all of the seven 2020 OSNAP cruises have been carried out successfully. Special thanks to the PIs from the observational groups who worked tirelessly in (re)planning the cruises to accommodate the extraordinary challenges caused by the pandemic. All cruises had to reduce their working time at the mooring sites because of the need for more transit time to and from their home port. All observational groups outperformed expectations: everyone was safe and the data return was superb. We also applaud the captain, the crew and everyone on the science teams! With all of these efforts, we will be adding another two years of transport estimates in 2021 without significant delays.
References
Lozier, M.S., F. Li, S. Bacon, F. Bahr, A.S. Bower, S.A. Cunningham, M.F. de Jong, L. de Steur, B. deYoung, J. Fischer, S.F. Gary, B.J.W. Greenan, N.P. Holliday, A. Houk, L. Houpert, M.E. Inall, W.E. Johns, H.L. Johnson, C. Johnson, J. Karstensen, G. Koman, I.A. Le Bras, X. Lin, N. Mackay, D.P. Marshall, H. Mercier, M. Oltmanns, R.S. Pickart, A.L. Ramsey, D. Rayner, F. Straneo, V. Thierry, D.J. Torres, R.G. Williams, C. Wilson, J. Yang, I. Yashayaev, J. Zhao, A Sea Change in Our View of Overturning in the Subpolar North Atlantic, Science, 363(6426), 516-521 (2019).
Li, F., M.S. Lozier, S. Bacon, A. Bower, S.A. Cunningham, M.F. de Jong, B. deYoung, N. Fraser, N. Fried, G. Han, N.P. Holliday, J. Holte, L. Houpert, M.E. Inall, W.E. Johns, S. Jones, C. Johnson, J. Karstensen, I.A. LeBras, P. Lherminier, X. Lin, H. Mercier, M. Oltmanns, A. Pacini, T. Petit, R.S. Pickart, D. Rayner, F. Straneo, V. Thierry, M. Visbeck, I. Yashayaev, C. Zhou, Subpolar North Atlantic Western Boundary Density Anomalies and the Meridional Overturning Circulation, submitted to Nature Communications (2020).