By Anne-Sophie Fortin
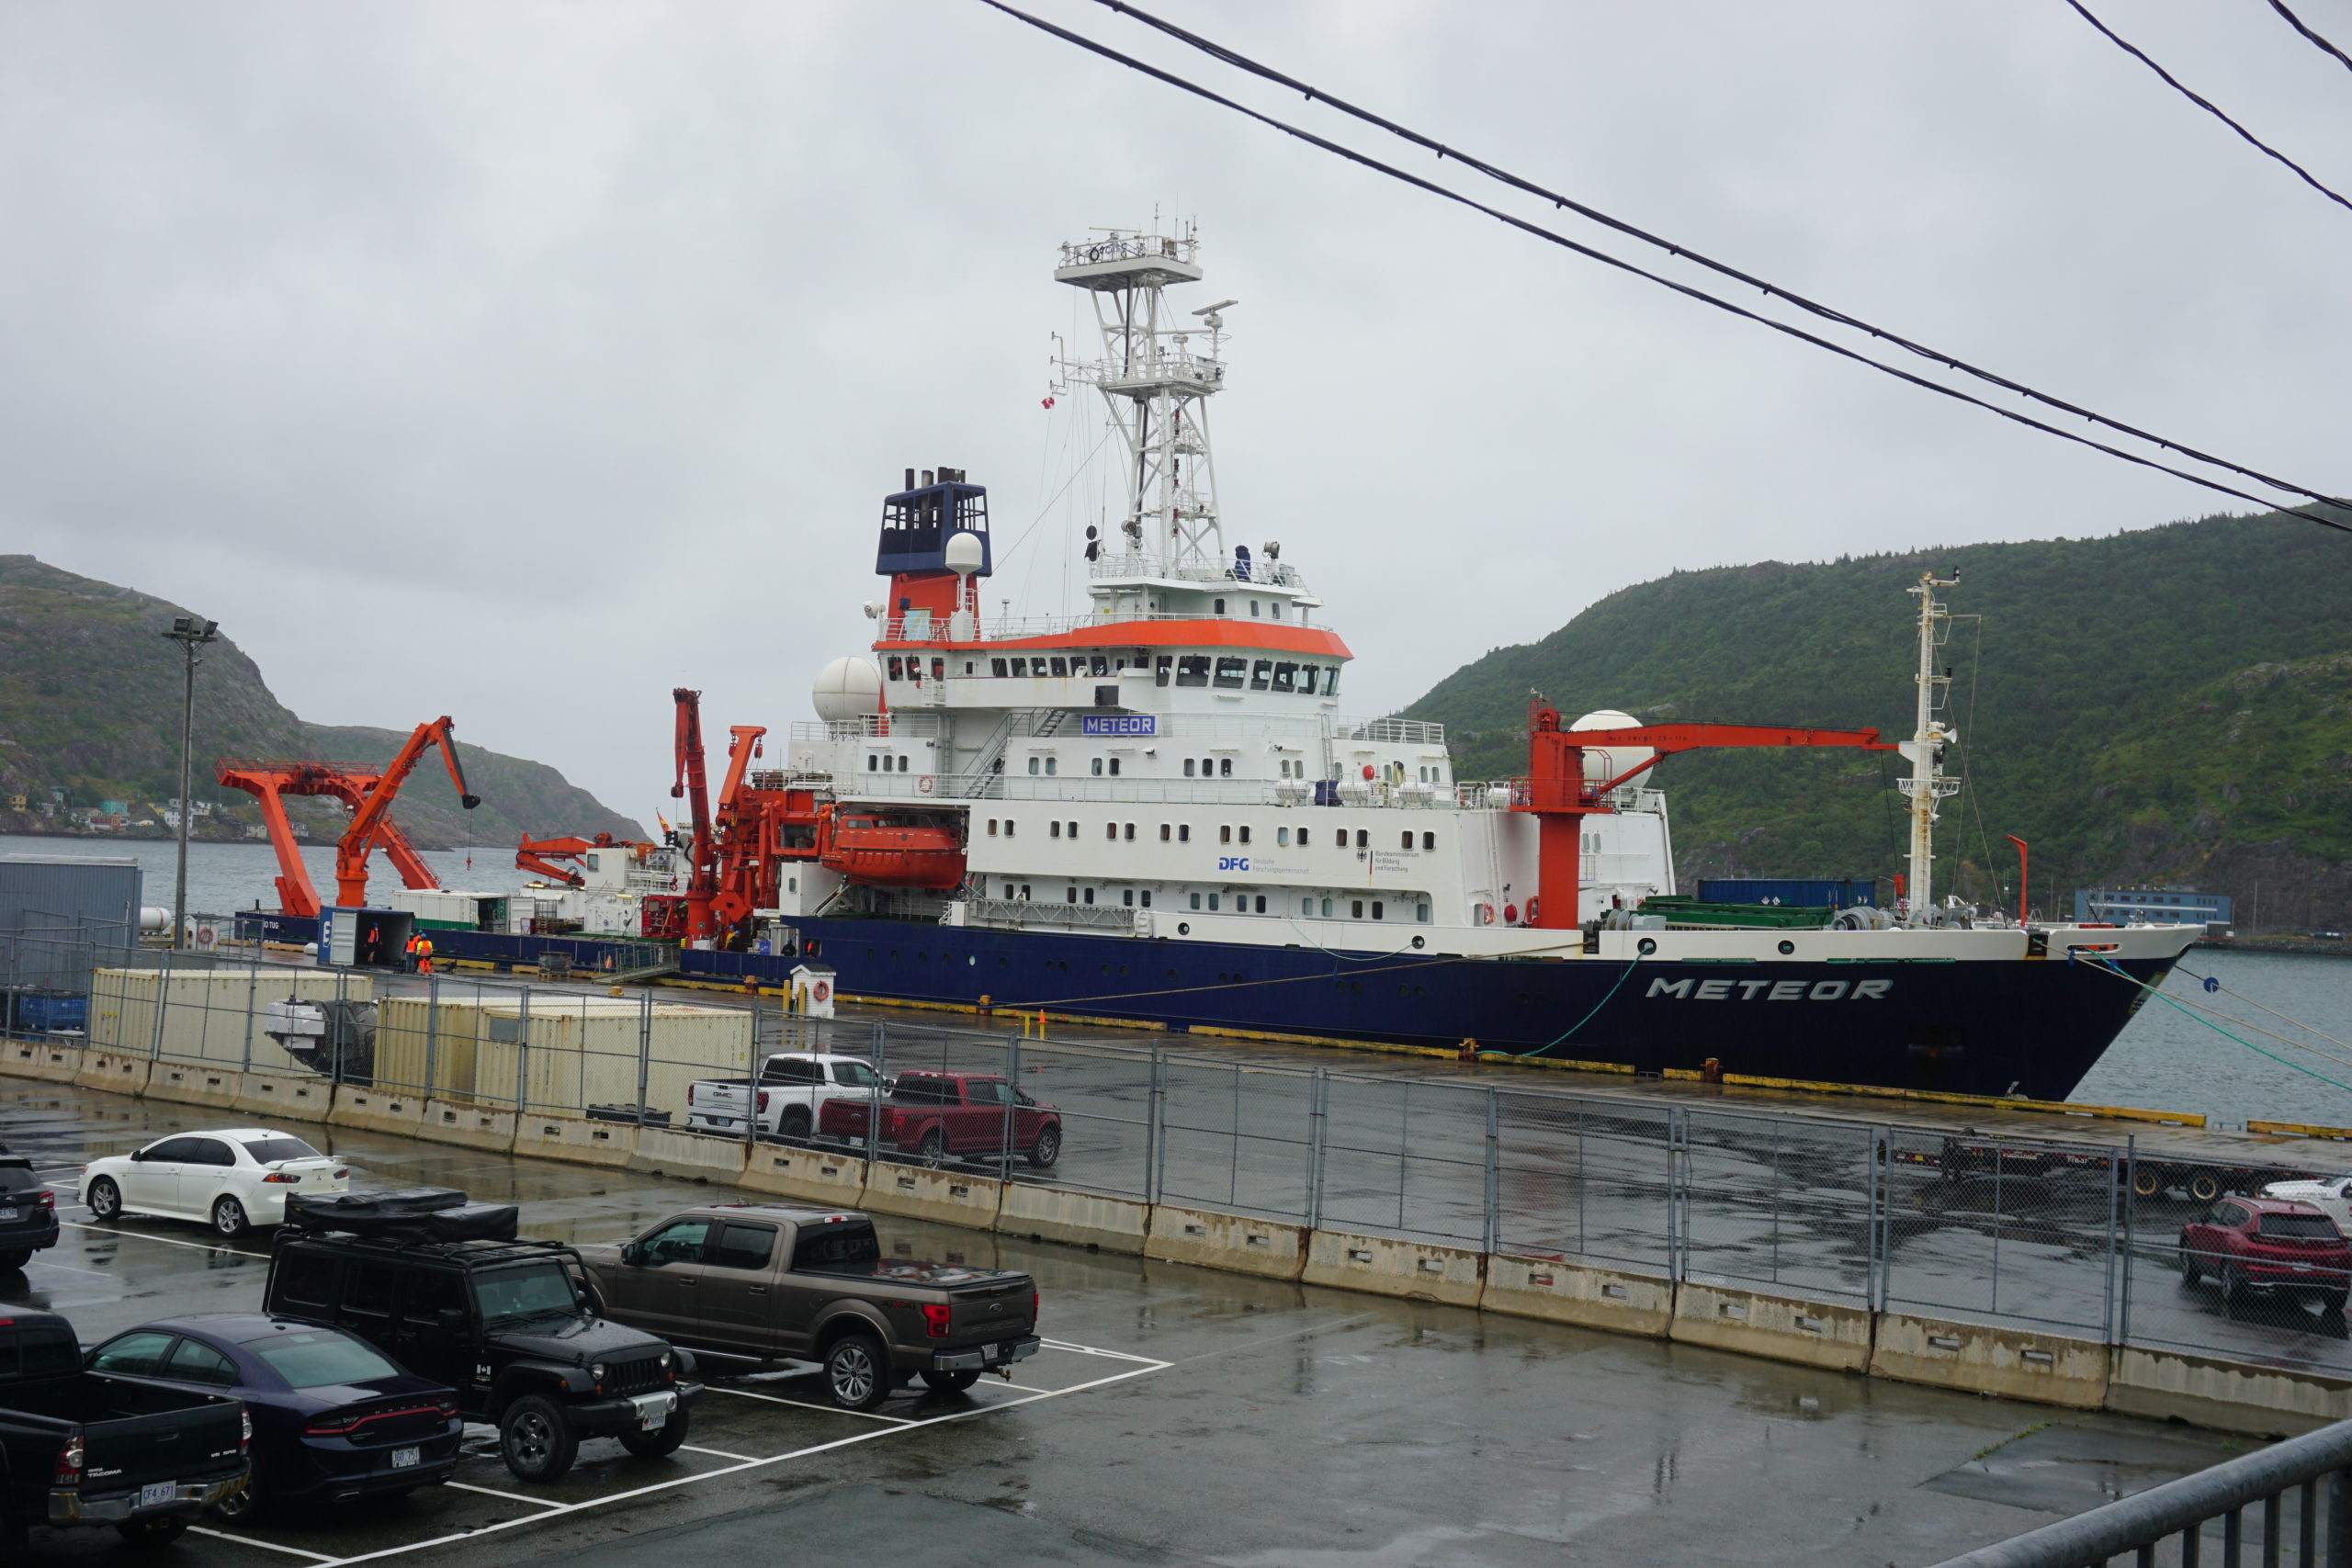
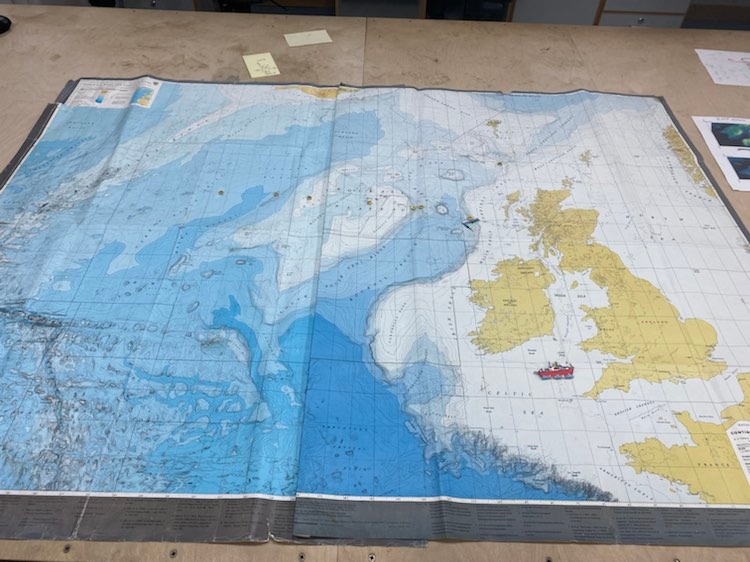
Departure from St John’s Harbour
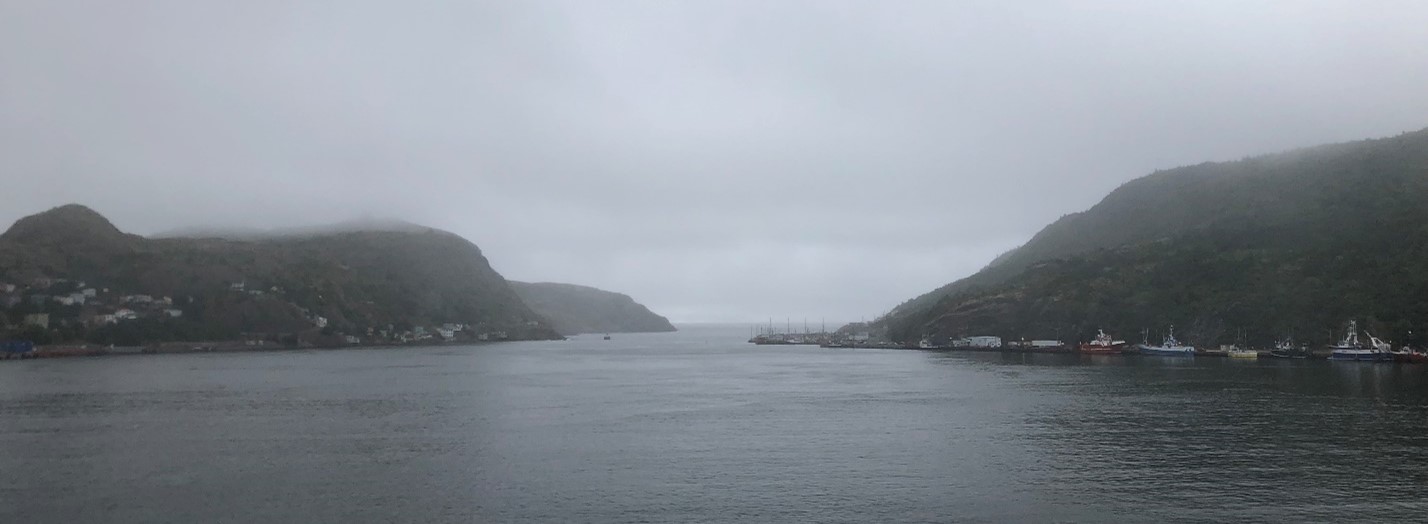
August 11-12, 2022
The water is still in the harbour by night. Shrouded in what seems like a perpetual mist, the Meteor is waiting patiently. People step aboard the ship in small waves and wash up in their beds, exhausted from their long flights. As the sun rise, the crew finalizes the preparation for the departure. A few hours later, we are all on the deck to say goodbye to St John’s. As the ship leaves the harbour, we have a stunning view of St John’s rocky coast. As the land fades away, the swell appears and activities on board begin!
You may find this blog post also at https://www.oceanblogs.org/meteor184. In addition, you can follow Meteor’s position and path at https://beluga.geomar.de/m184.
Meet the Scientific Crew Abord the M184 Cruise
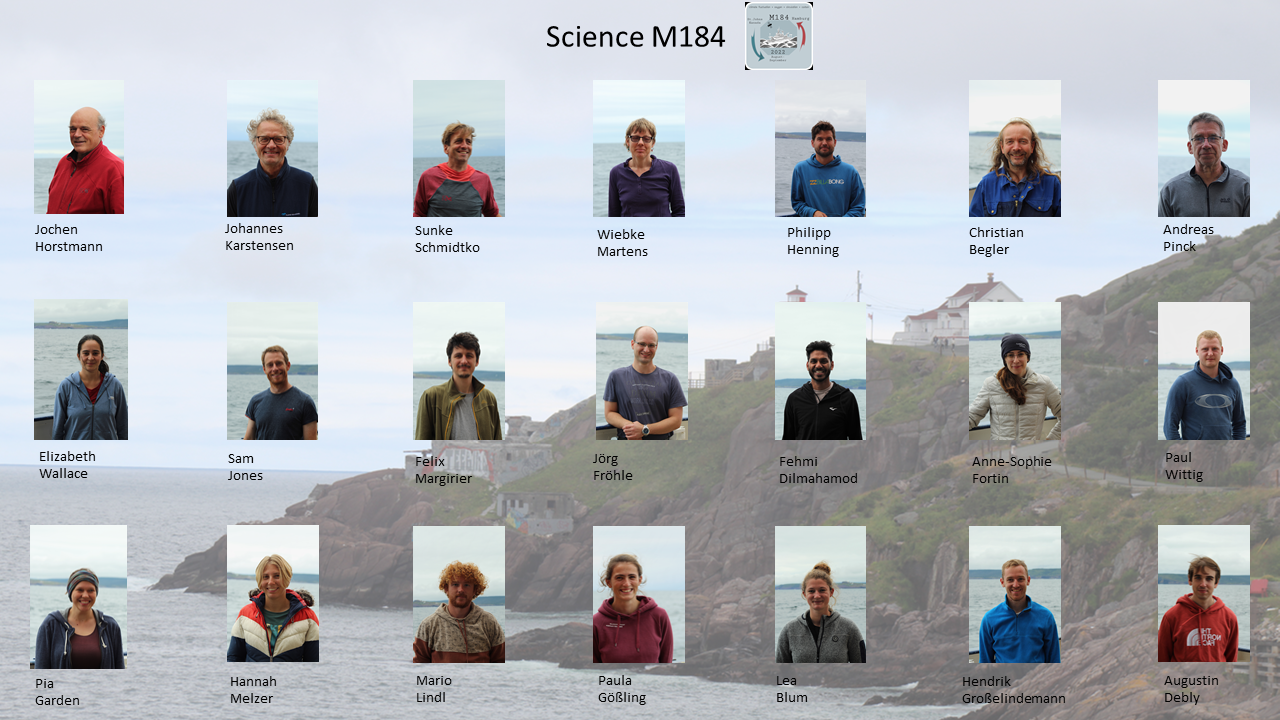
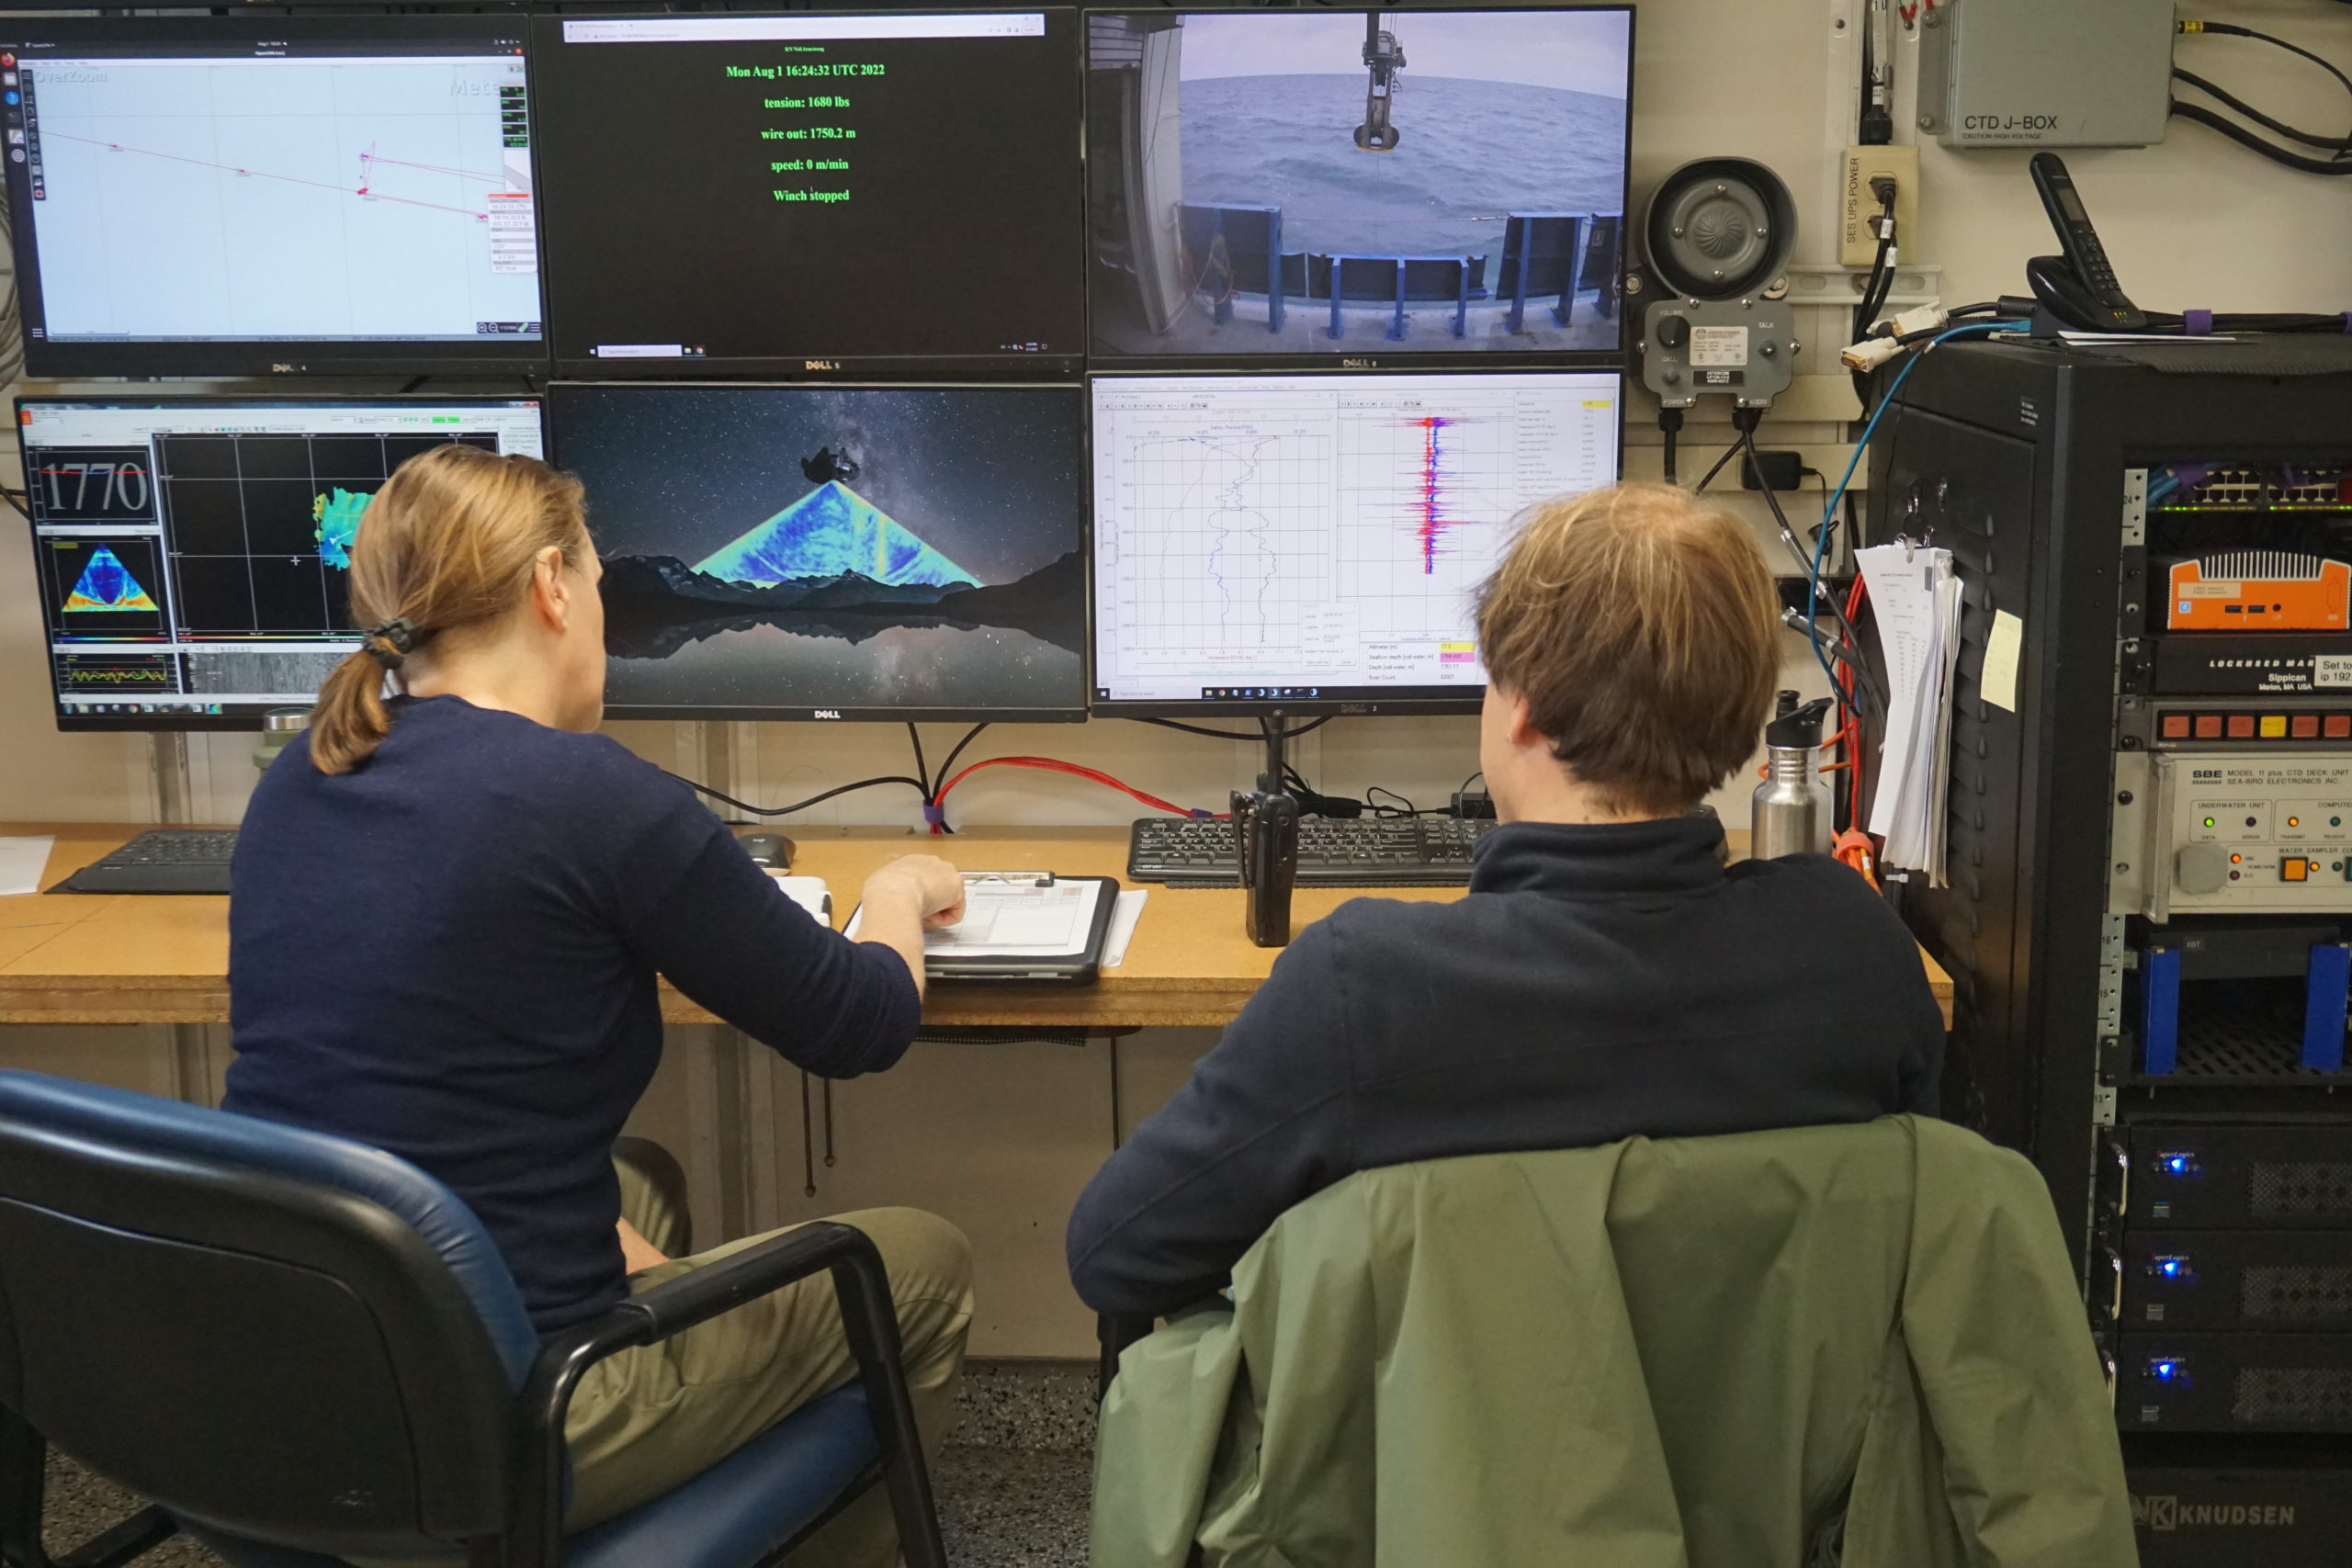
First, let me introduce to you the scientific crew aboard the M184 Cruise. The chief scientist of this expedition is Johannes who takes care of the general smooth running of scientific activities on board. He can rely on Sunke (also a co-chief scientist), Félix, and Fehmi, the CTD watch leaders, and on the technicians Wiebke, Philipp, Christian, Andreas, and Paul, which are a great help in all kind of situations.
Paula, Augustin, Hendrik, Mario, Pia, Sam, Jörg, Anne-Sophie, and Hannah are split into three groups that are under the supervision of the CTD watch leaders. These teams are doing rotating shifts so that real-time data is taken around the clock, even at night.
Some people on board take the lead responsibility of specific experiments, such as the analysis of nutrients and oxygen in the water performed by Elizabeth and Lea. Sam oversees the deployment of a highly sensitive bottom pressure instrument from the Scottish Association of Marine Science (SAMS) that has a 10-year lasting battery. This instrument is one of a set of two designed to measure the sea surface height across the North Atlantic. Jochen and Paula handle the deployment of Hereon drifters, which follow surface currents. Paul manages the MicroCATs, i.e., the instruments measuring the temperature and conductivity, on the moorings deployed as part of the OSNAP program.
Throwing Scientific Instruments Overboard
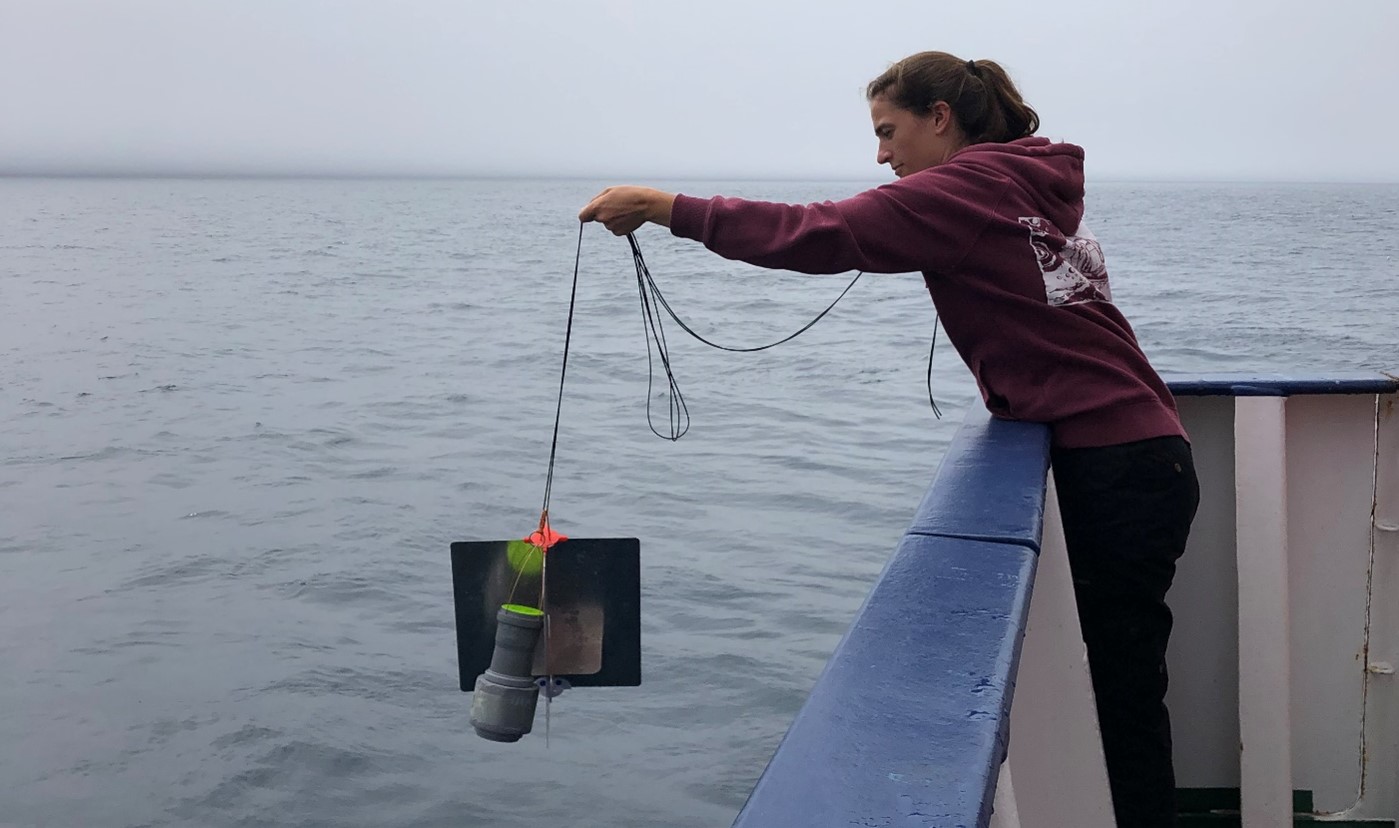
August 13, 2022
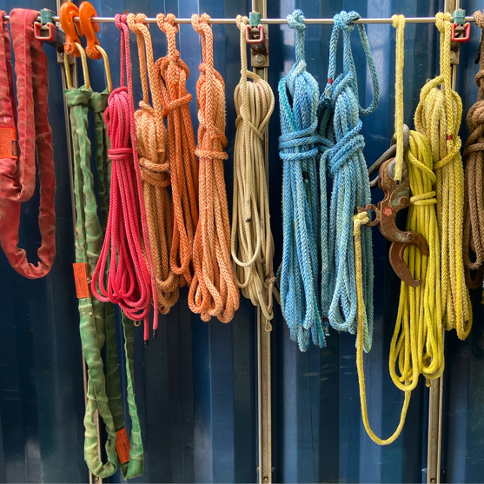
Today we (purposely) throw some scientific instruments overboard, the firsts of many. In the picture, you may see Paula lowering a Hereon Drifter with a rope. A Hereon Drifter is a Lagrangian surface drifter, which means that it follows the water mass where it has been deployed, under the condition that the water mass in question stays in the upper part of the ocean as the Hereon Drifter float at the surface. It is quite useful to estimate upper water currents as the instrument report its position every 5 minutes.
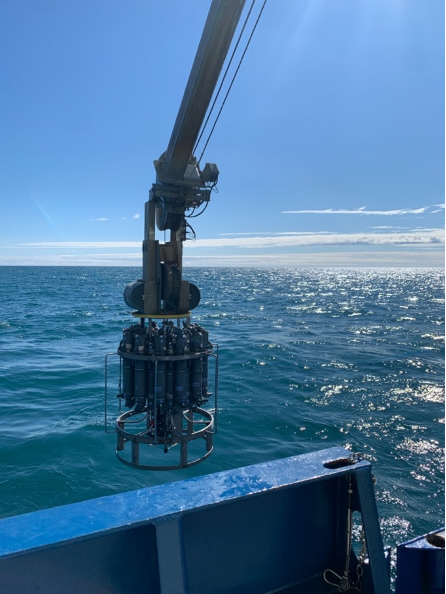
Upper Ocean Survey with the Moving Vessel Profiler
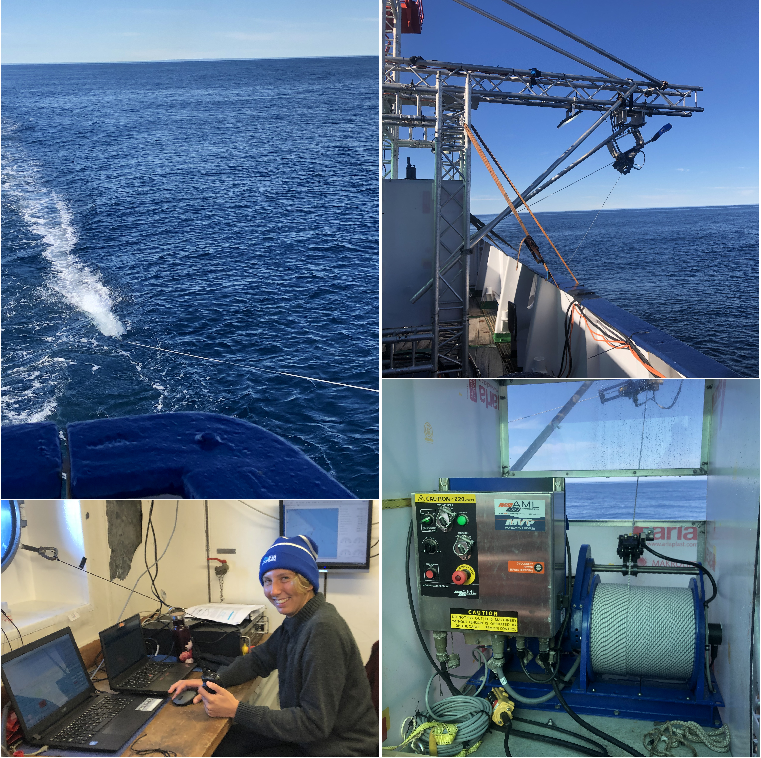
August 14, 2022
As we transit toward the next station with a speed of about 10 knots, we are taking continuous profiles of the upper 100 meters of the ocean. To do so we use a Moving Vessel Profiler (MVP), an instrument measuring temperature and conductivity (from which salinity can be derived) is free-falling in the ocean and then automatically pulled back to the surface.
The goal here is to survey the Labrador Current fronts, which are sharp changes in the temperature and salinity vertical structure over short distances, and the mixing of Labrador Current water with other water masses over the Labrador continental shelf. The Labrador Current is a water mass particularly cold, fresh, and high in dissolved oxygen.
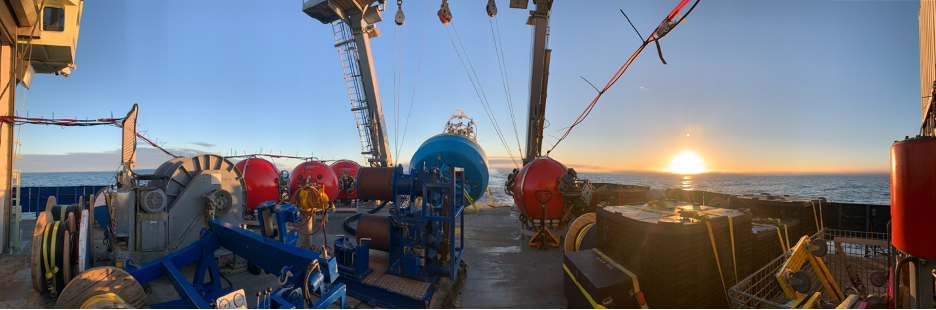
Testing Instruments in the Deck Pool
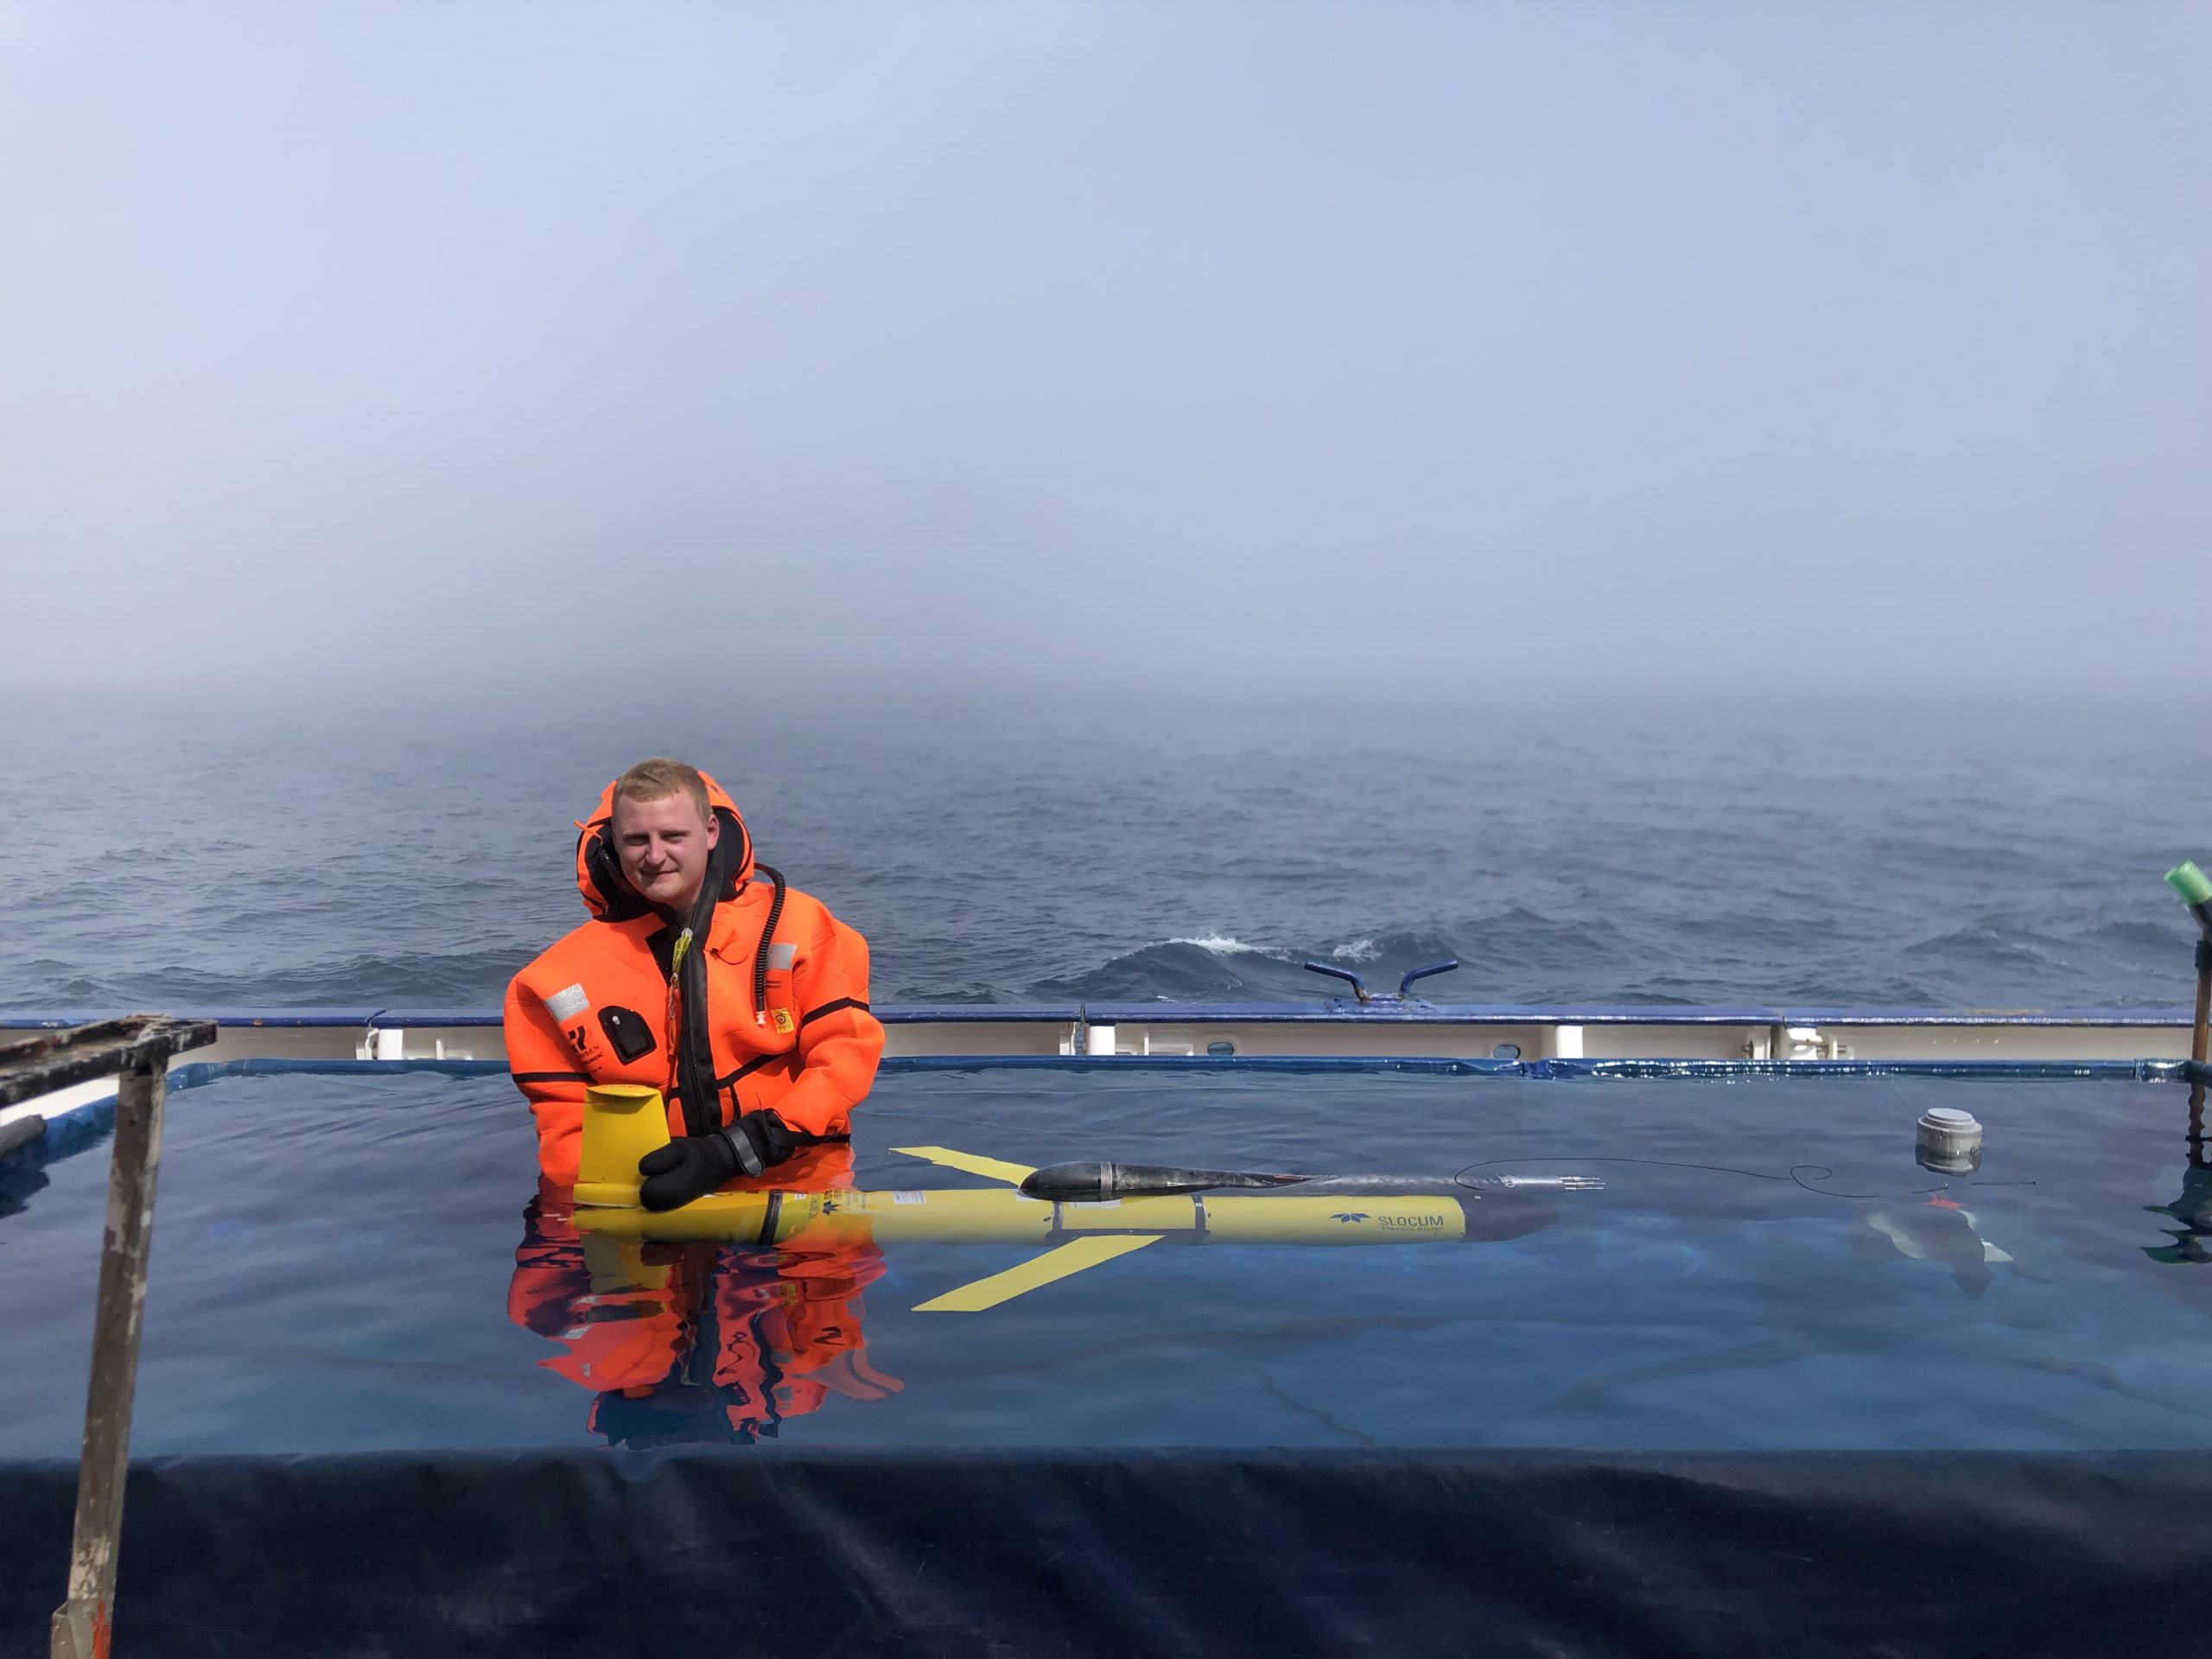
August 14, 2022
Today was entertaining as Paul, Félix, and Christian calibrated the buoyancy of two Gliders. Gliders are autonomous underwater vehicles using buoyancy to move around. As they can change their pitch, i.e., angle, they can glide horizontally while moving up and down the water column. Calibration of the Glider’s buoyancy consists of setting the Glider density close to that of the water mass it is deployed. To do so, a small pool has been assembled on the deck and filled with seawater. Then Paul and Félix put on an aquaphobic combination to not get cold as they had to stand still in the water which temperature is around 10oC. After successful tests, the Gliders are now ready for deployment in the ocean, but that will be for another day.
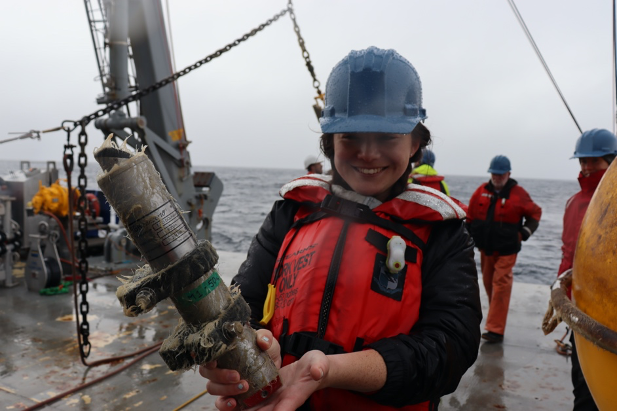
Station K8 – Recovery of a Mooring Array in the Fog
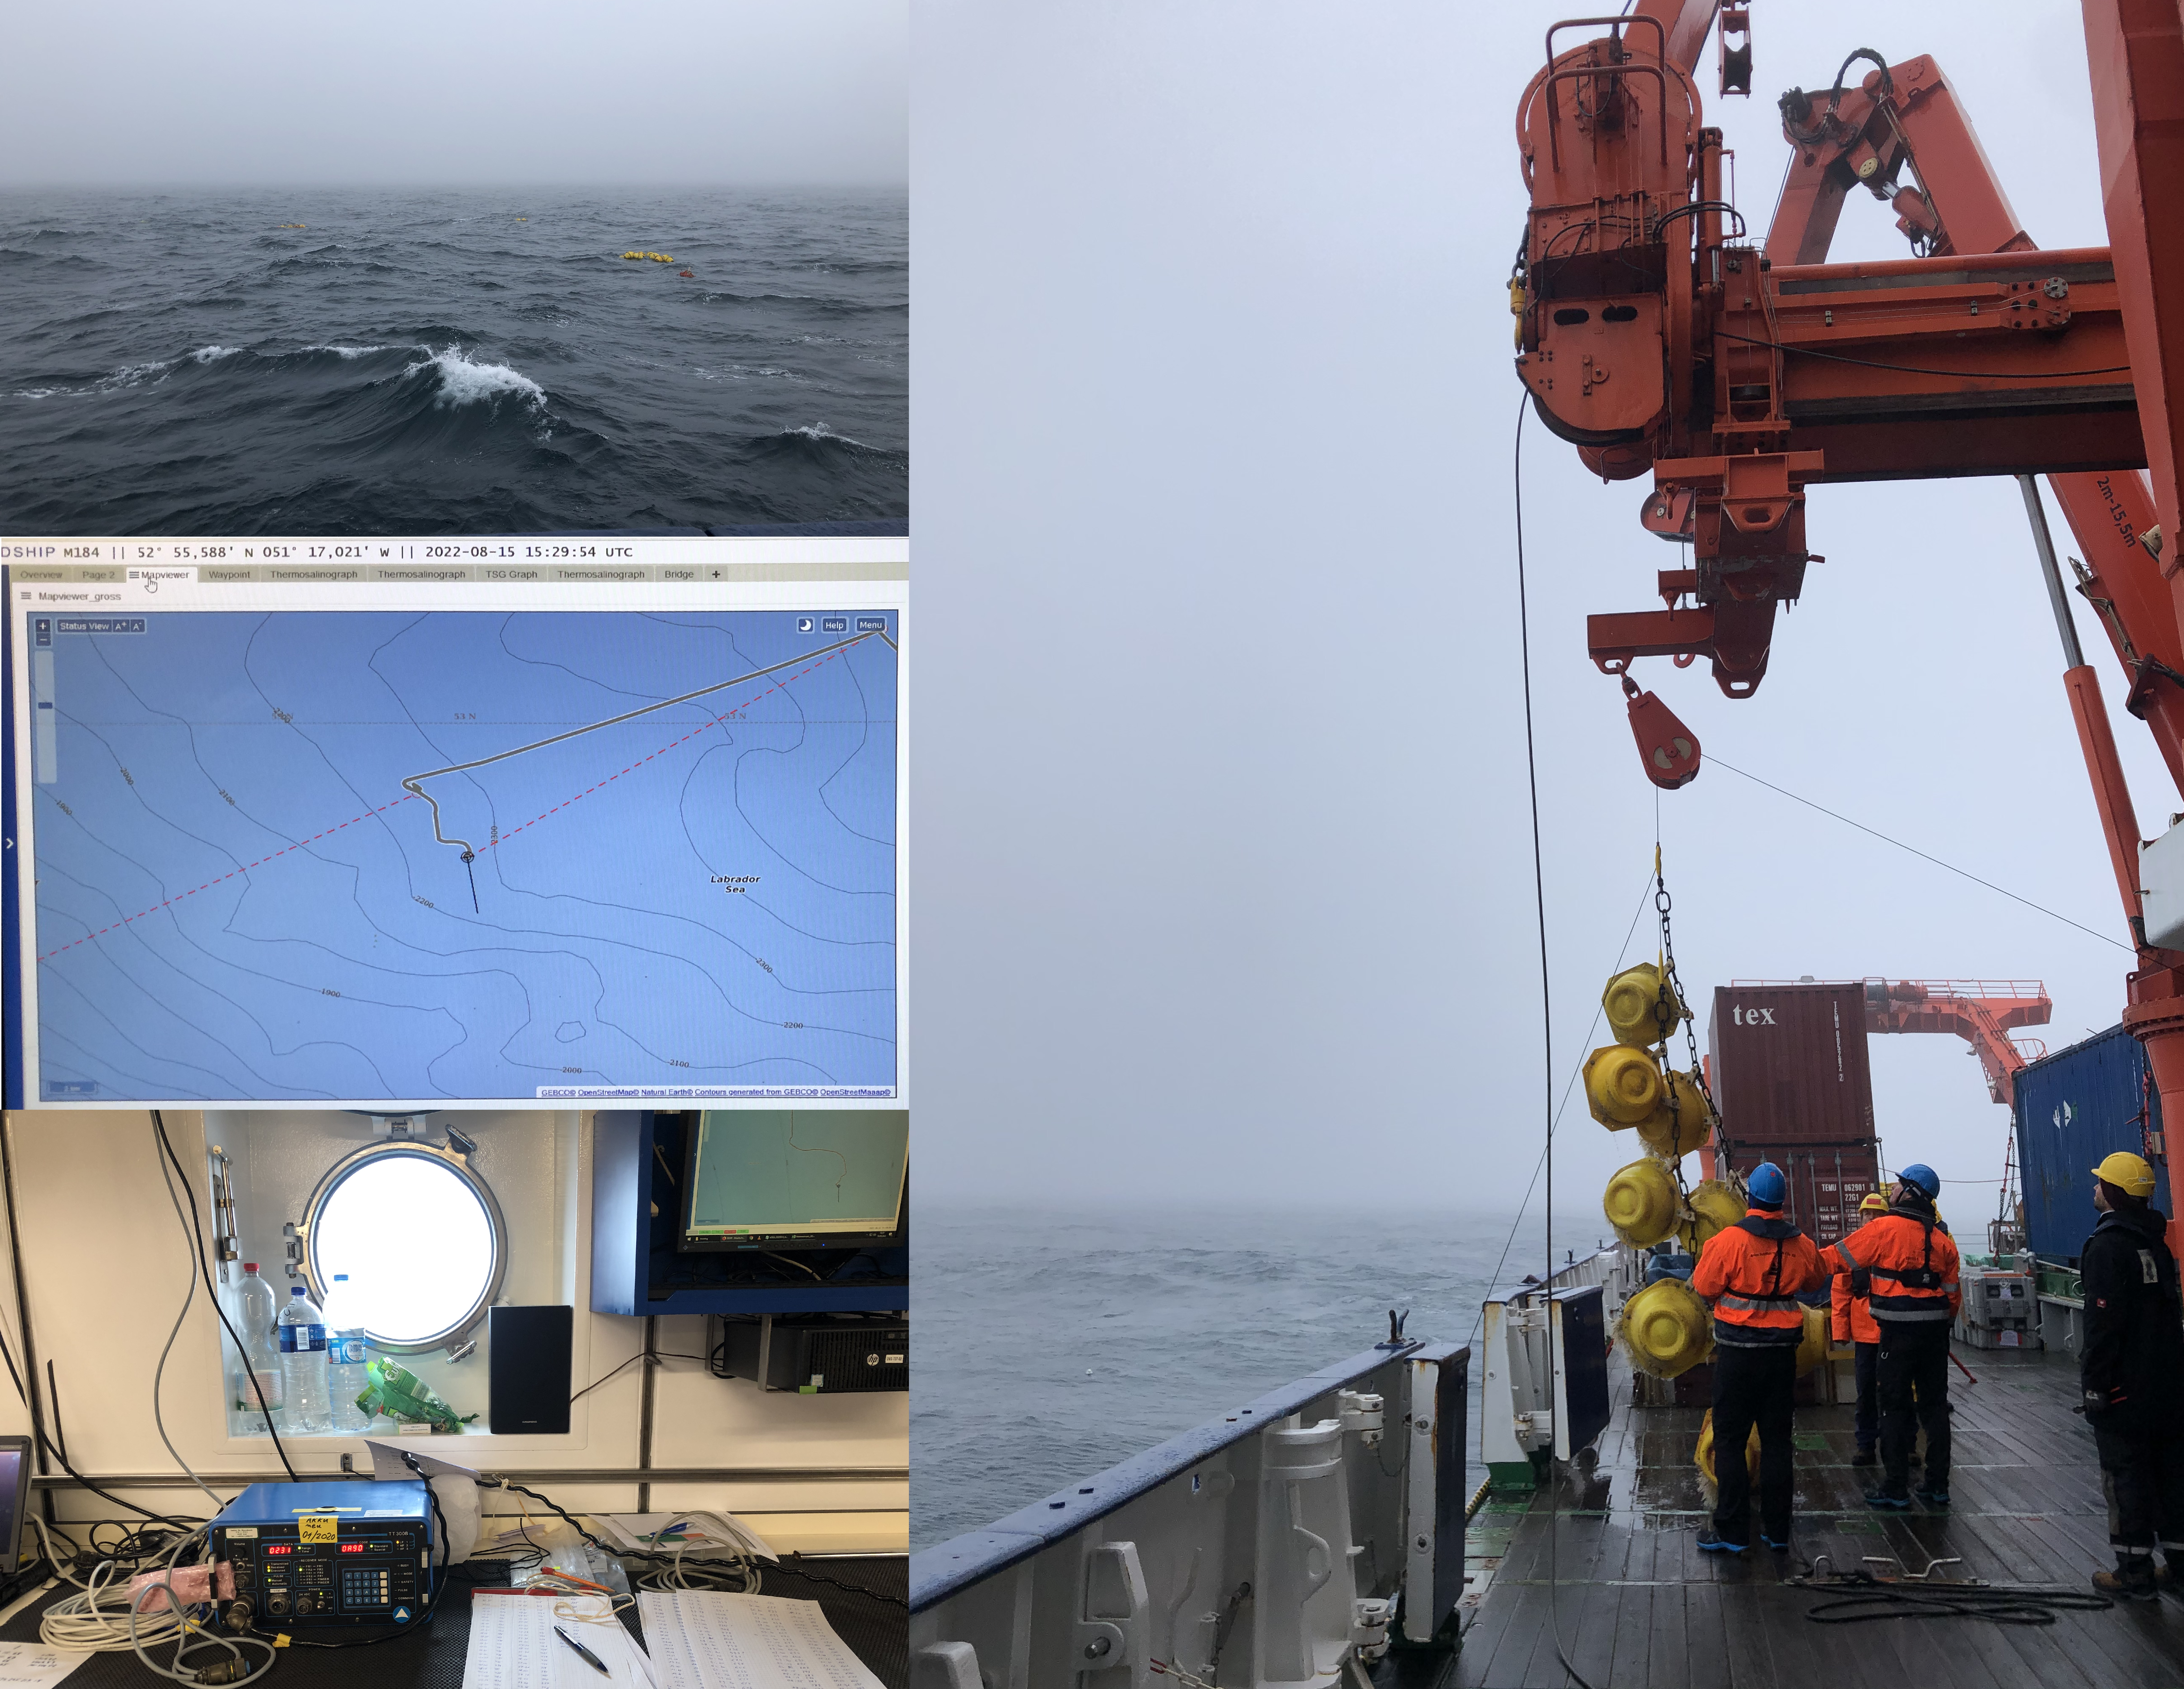
August 15, 2022
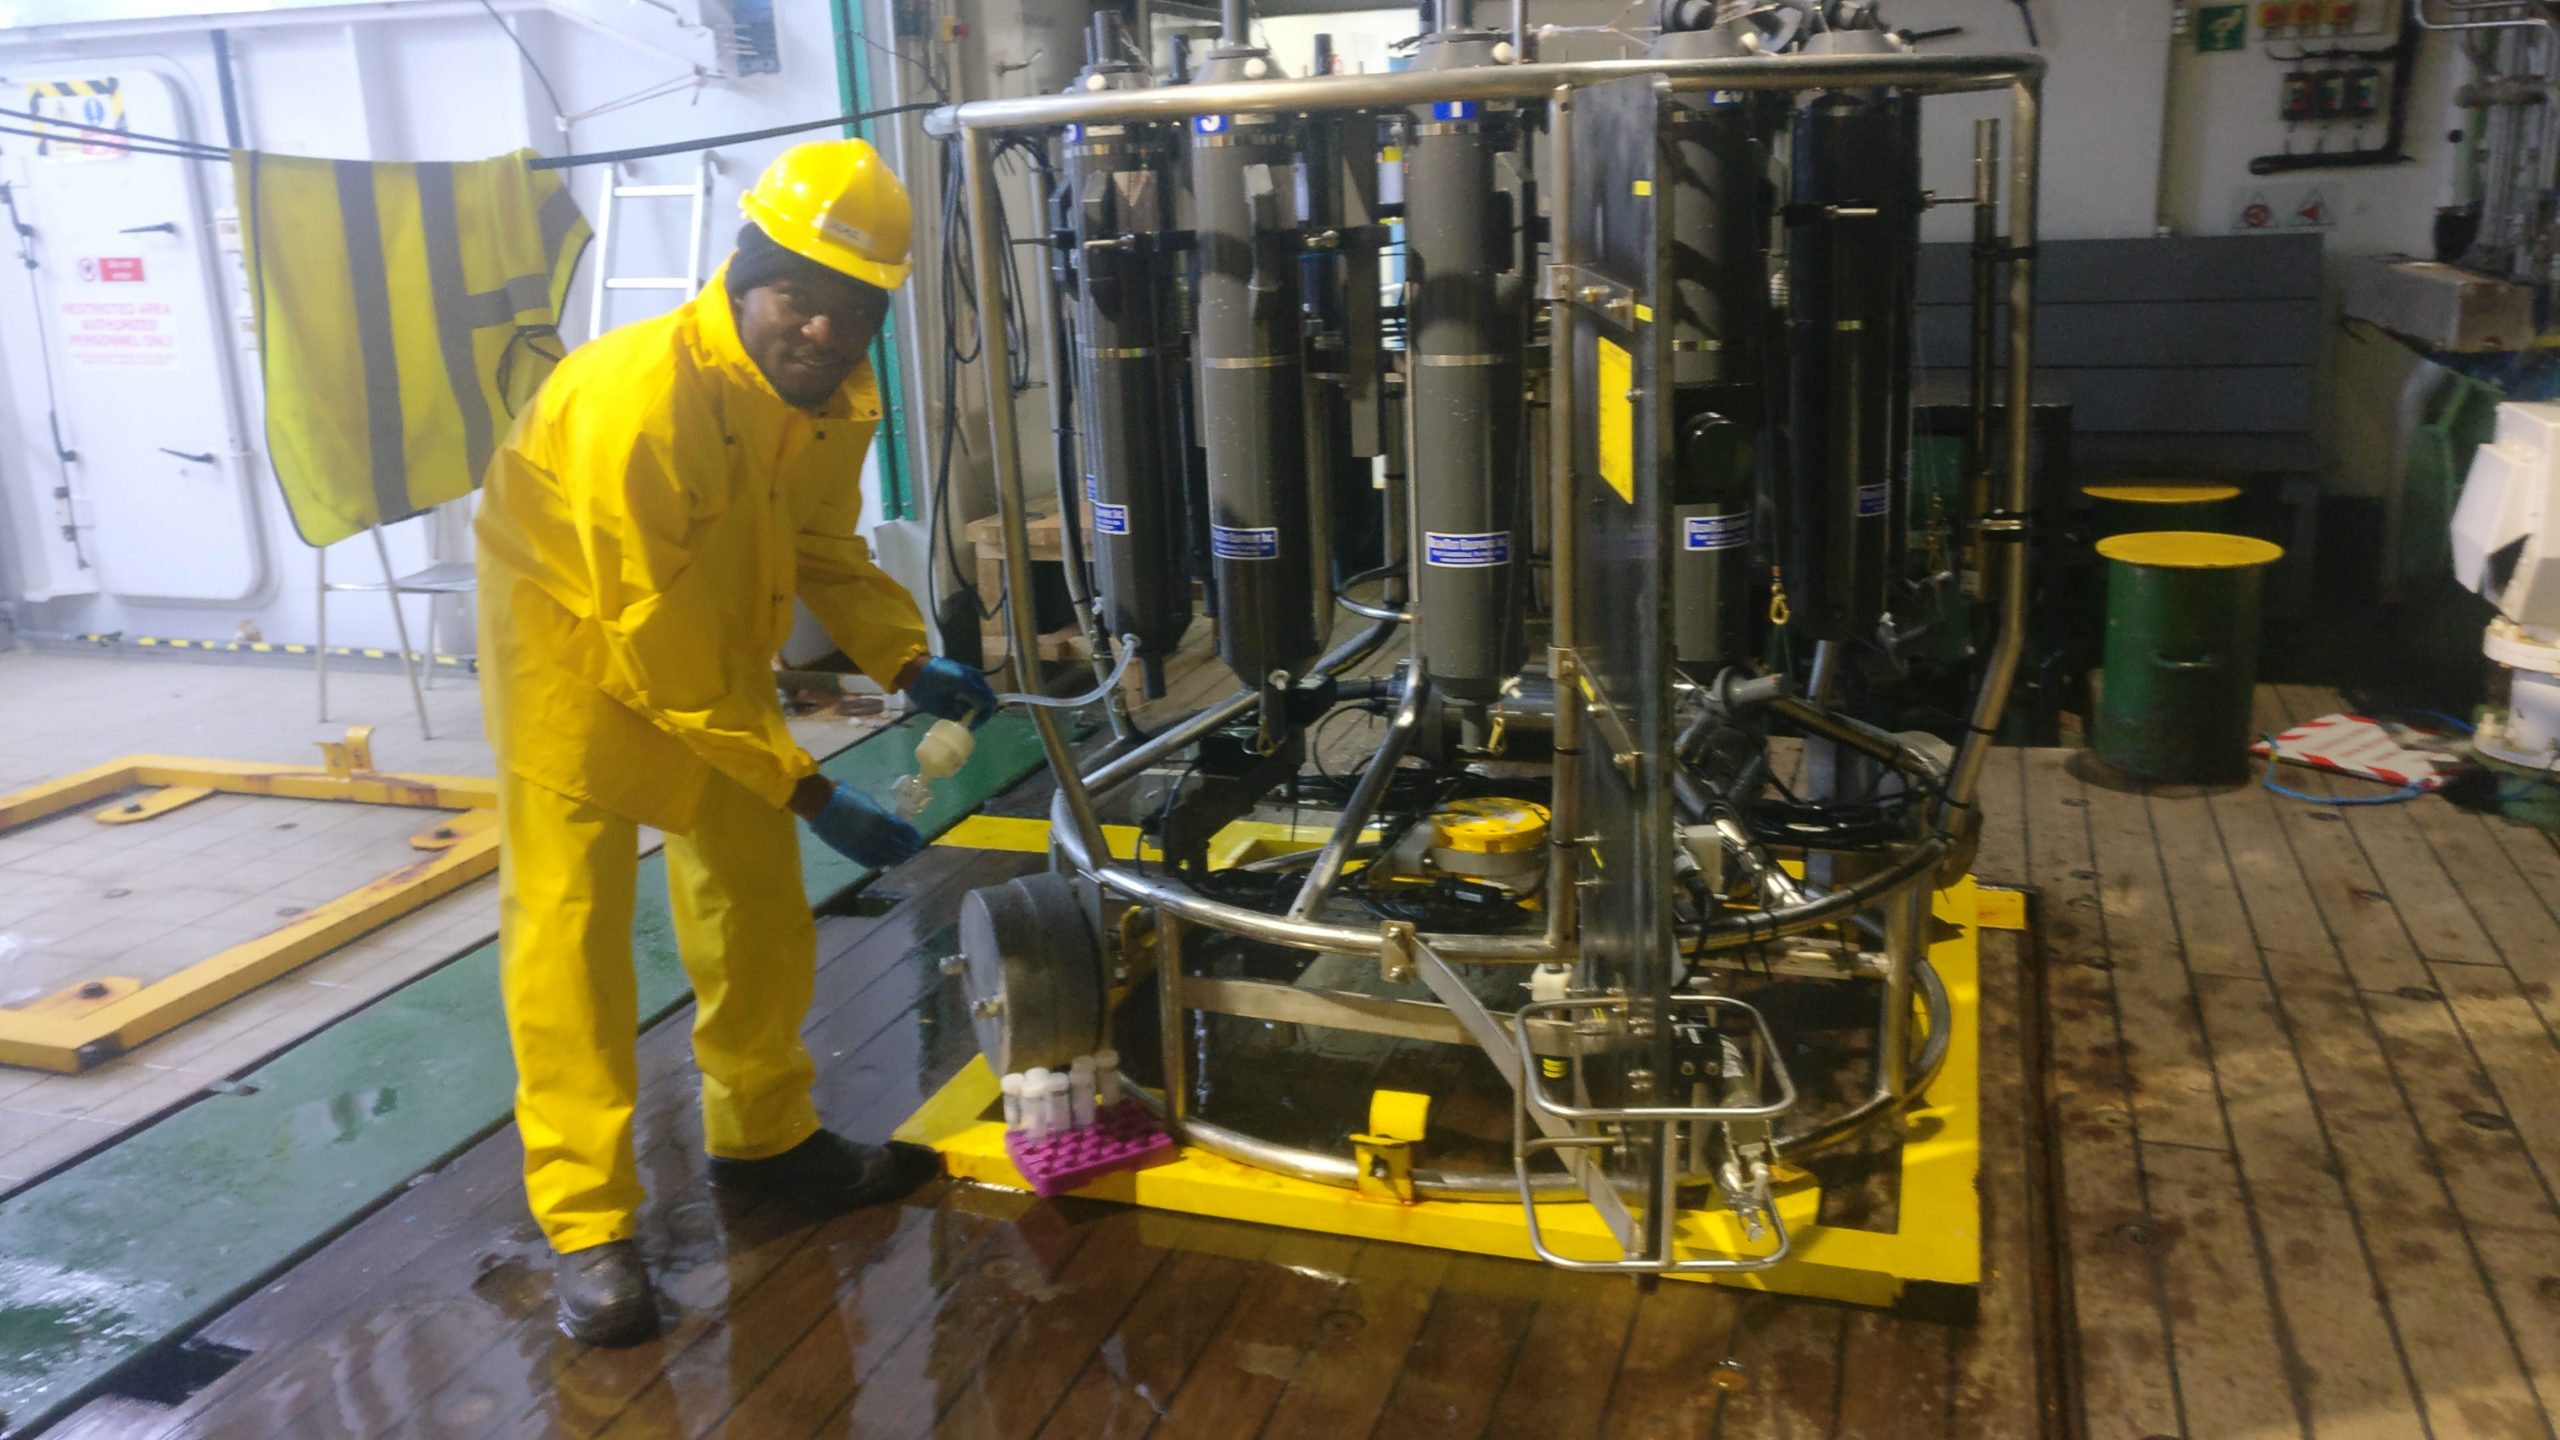
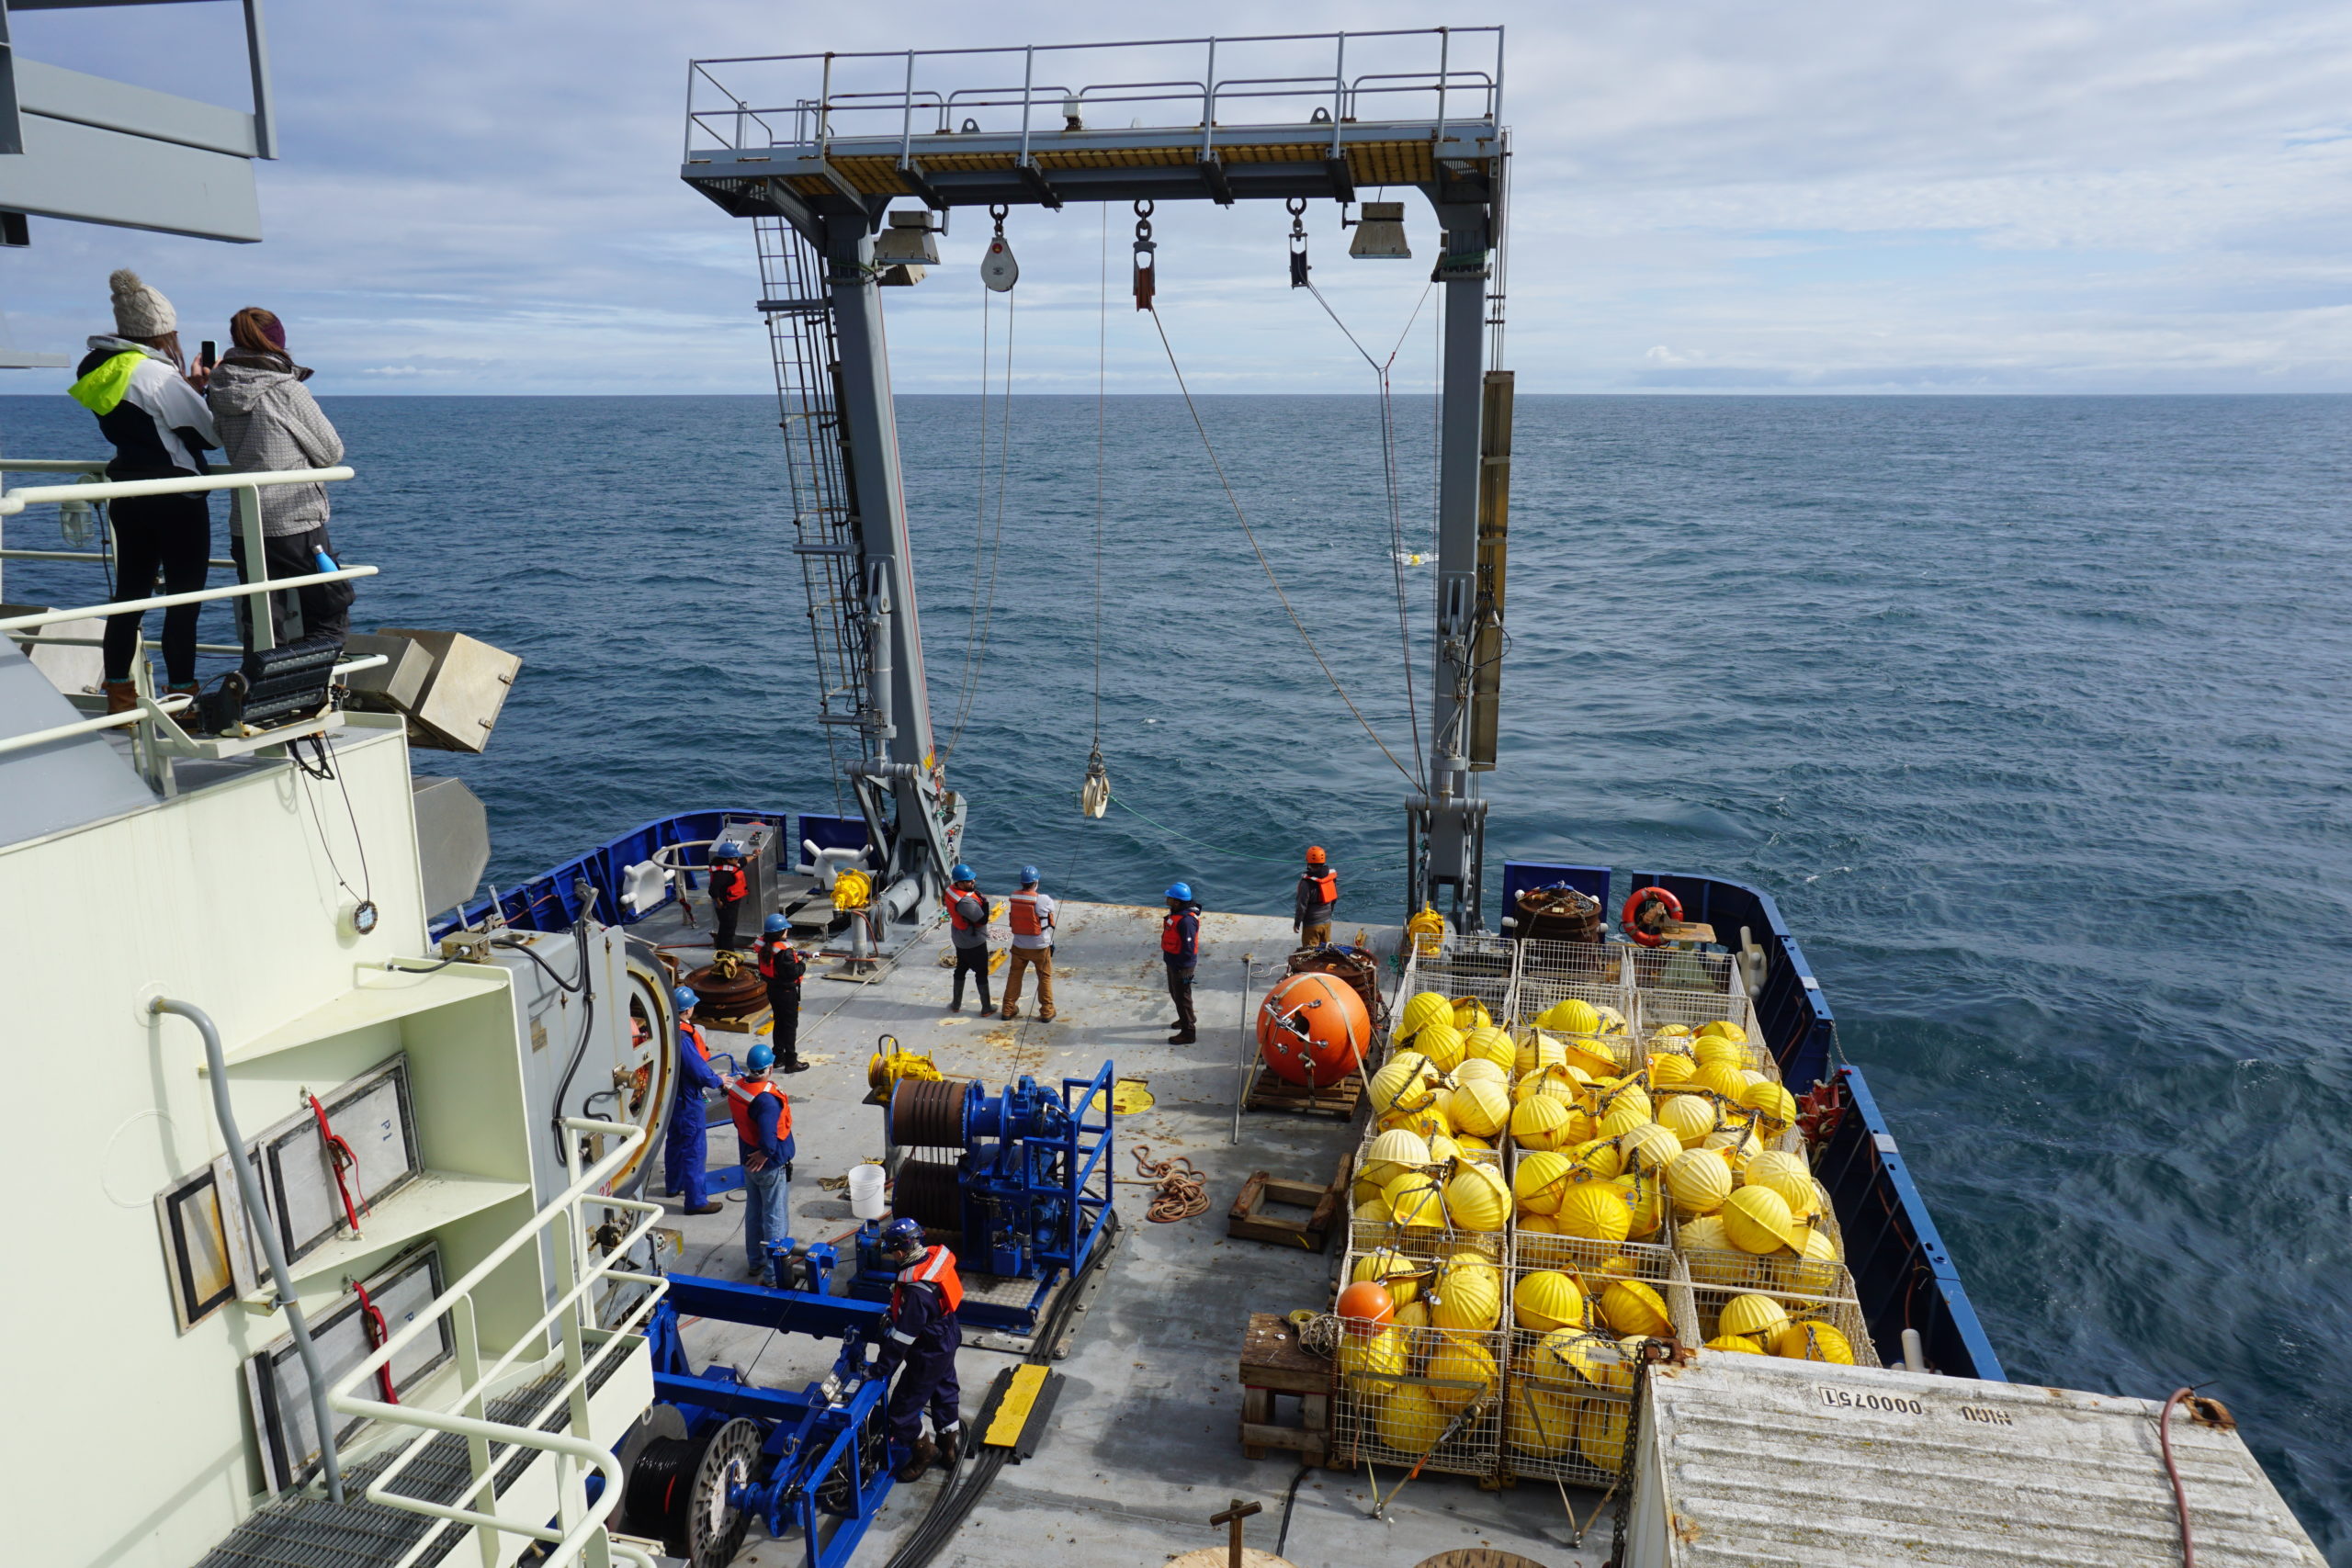
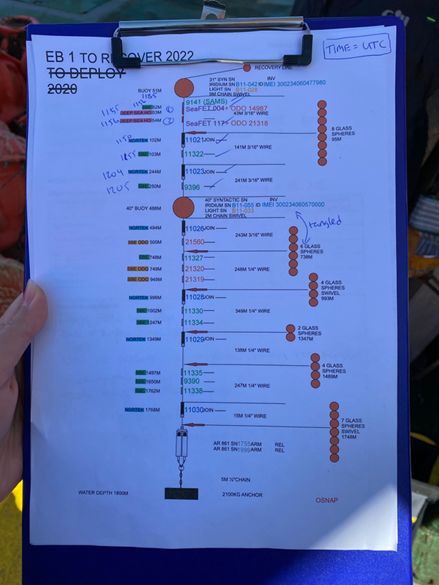
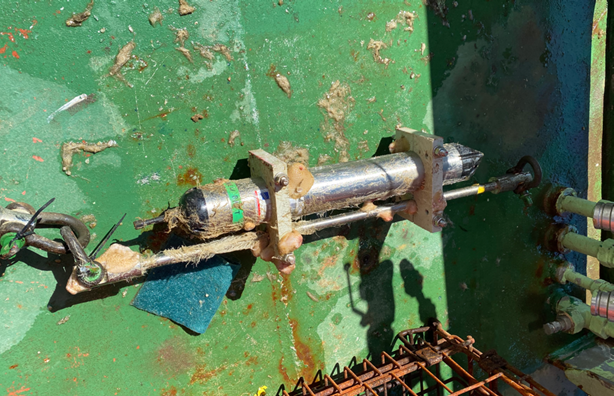
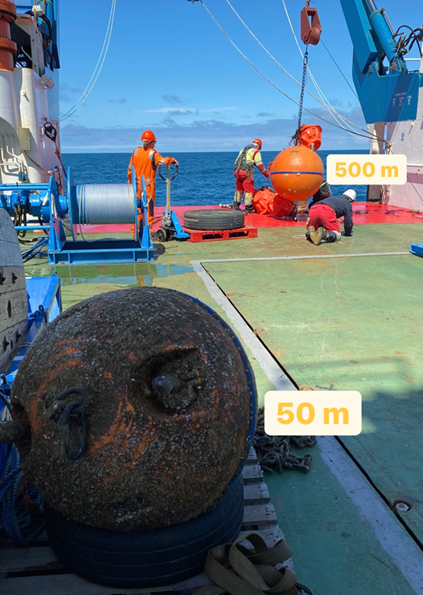
To measure the ocean circulation, mooring arrays have been deployed since 2014 in the Labrador Sea as part of the OSNAP program (o-snap.org) and are serviced every two years by scientific expeditions like ours. Today we successfully recovered the K8 moorings and the measurements that it took over the past two years. But it was not so easy!
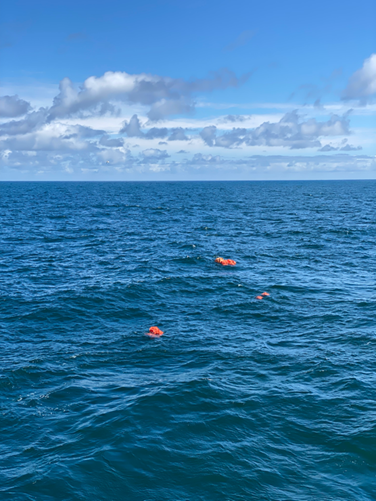
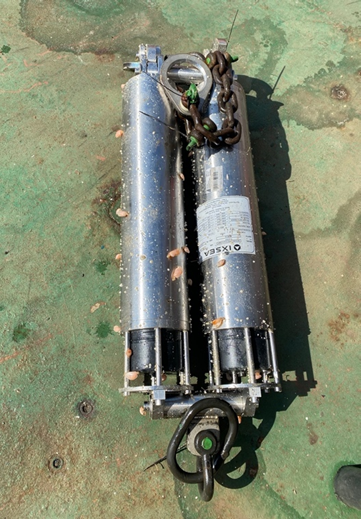
The weather was quite nice in the morning. As we were approaching station K8, we sent an acoustic signal to the K8 mooring array so that it detaches itself from its anchor and starts floating at the surface. However, a few moments later, we entered a thick fog, which complicated the recovery. Despite the fog, we could guide ourselves to the array using the acoustic deck unit, which shows at which distance we are from the array. After a few hours of hunting in the fog, we finally got visual contact with the array. The crew then recovered the mooring array with their winch, and we could start cleaning it, extracting the datasets, and the preparation to put it back to sea for another two years.
Glider Deployment
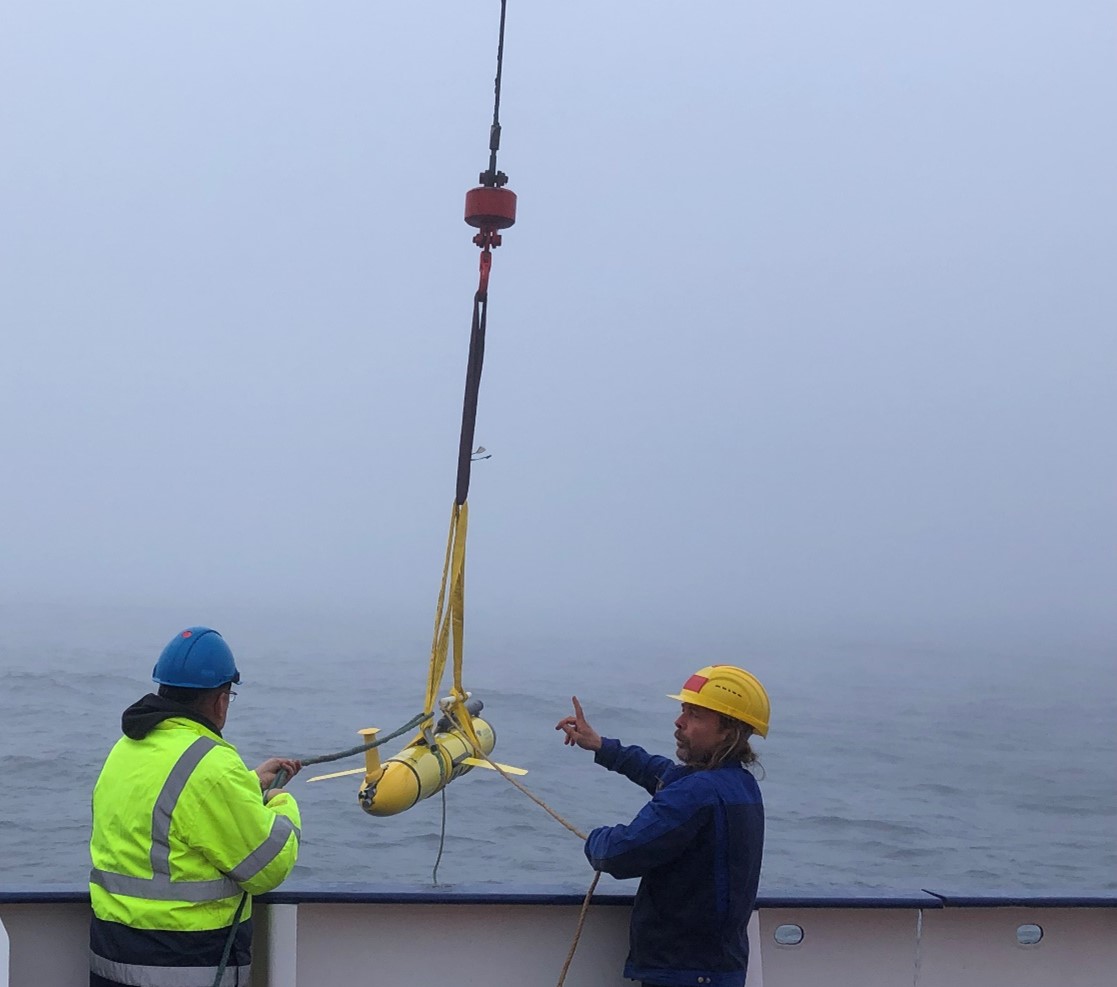
August 16, 2022
After the successful calibrations performed yesterday, one of the two Gliders has been deployed today. It will be autonomous and take measurements of water properties, such as temperature, salinity, oxygen, and chlorophyll until its recovery a few days from now.