Category Archives: blog

OSNAP (Ocean Sentiments, or Newly Arisen Ponderings)

By Ayden Schirmacher, Boston University student

As someone who grew up on the west coast of the United States, the ocean has always been a part of me. I think it was something I took for granted, that it was always going to be there, and maybe I didn’t visit as much as I should have. But as with many young people, there are often any number of other things more pressing than staring into a watery horizon. As I have gotten older though, I find myself understanding more and more why everyone from poets to real estate moguls to scientists have been captivated by the ocean, recognizing its value and potential.

I’ve had time in excess during this cruise, given that our transit was a substantial eight days from Woods Hole to the Irminger Sea, and most of my work on the ship had to do with CTD casts. Yet for this whole time, there have been very few moments of silence, maybe three colorful sunsets, and only a few days of smooth waters. The sun has been coming out more recently – my new favorite color is just “ocean” – but for the most part we have been in a dense fog on choppy seas. The result is a veritable cocoon of water, both underneath and around us, narrowing the possibility of sight to what is right in front of you. Still it is amazing what you can see in that tiny bubble – fin whales approaching from the starboard side! Fulmars flying behind! The buoy is bobbing away into the fog, can you see it go? I love it.

As a first-time sea-goer and student, I have learned so much and had my eyes opened to some pretty amazing work. It has made me think a lot about the reciprocal relationship of humanity to the seas, a relationship which still contributes to the sustainability of the global population today through providing opportunities for livelihoods and resources. However, as we already know, it has been impacted by climate change. There are rising sea levels already posing a real danger to millions of people, on top of the decimation of marine ecosystems and biodiversity.

There is an idea that I love, that climate change impacts life on the planet, but not the existence of said planet. It is a horrific tragedy, the destruction our species is wreaking, but I find there is something comforting about the knowledge that the planet, and its oceans, will be around a lot longer than we can comprehend. The permanence of it all is awe-inspiring. It’s an idea that has big implications and is a little hard to wrap one’s head around sometimes. But it becomes a lot easier to get the point when on a not-insignificantly sized vessel, getting rocked around by 3-meter waves, which in the grand scheme of things isn’t even that bad.

That being said, it’s obvious that the destruction of life on this planet is awful. So it gives me hope that people are actively working to study and preserve the ocean and its systems. The operations carried out by the teams aboard the Armstrong are complex and difficult, but so far have been

conducted with a capability and efficiency that are most admirable. From the deck crew to the Chief Scientist, the impression is of a well-oiled machine actively working to ensure the scientific community and the public have access to the best data possible. Oceanography is a very special facet of that human-sea relationship: a way of understanding, but the ocean fights you while doing it. You have to earn the knowledge, which I think is quite beautiful.

I like knowing that while we may be floating in our little fog bubble in the Irminger Sea, the implications and impacts of the work being done here are far-reaching and important. Thus far, I have had one of the best months of my life. The ocean is certainly inspiring, both of fascination and a healthy dose of fear, and I am glad to be a part of at least a small part of the work being done to understand it better.

June 13, 2024 – The first rough seas of the trip. Image taken from the starboard side of the ship, facing the bow. Seas this day were an average of 2.5m.

June 13, 2024 – Waves crashing over the side of the ship as work is being done on the CTD/Niskin rosette. Sampling in these conditions is not for the faint of heart!

June 13, 2024 – Panoramic view of the waves during the middle of the day. Fast winds make for the whitecaps on the waves.

June 16, 2024 – Even though they don’t like to land on the ship, the sea birds frequent the skies and seas around us. Sometimes they get close enough to see every feather!

June 20, 2024 – Occasionally the sun will be out during the day, but tends to go away in the afternoon behind fog. On this day, the clouds were broken enough to see some light, and the clouds ended up looking like an abstract version of the Northern Lights.

June 20, 2024 – This far north, the skies may not have the traditional orange sunsets, but the purples are just as beautiful. The rarity of having a colorful sunset just makes you appreciate it even more!

June 21, 2024 – My new favorite color is “ocean”. On this day, the sun came out in slivers, but lit up the sea so that it became a beautiful blue/purple/silver color.

June 03, 2024 – the last “real” sunset of the trip, on our second day at sea. Ever since then, we have been too far north to really see the sun go down at a reasonable hour.

June 04, 2024 – A humpback whale flips its tail up at us as we sail past. 

June 06, 2024 – The dense fog creating a grey wall. But it’s beautiful in its own way.

June 22, 2024 – Sometimes the sun peeks through if you can catch it at the right time.

Neil Armstrong – Woods Hole

By Emma Brown, Boston College student

We arrived in Woods Hole! We immediately began lashing down anything that exciting seas might send sliding. This included various boxes of scientific materials, including our toolbox, with bungee cords and ratchet straps. Our filtration system was placed on a sticky mat and bungee corded in both directions. Other boxes, some meant to hold future samples, were lashed in place in the cooler atop metal racks.

This morning, all hands were on deck to help board stores! A large crane lowered cloth nets bulging with boxes of goods into the ship, directed by crew members in hardhats. Once the goods had reached the floor, these crew members freed the net from the holding hooks and cut the boxes loose from their plastic packaging. Then, almost all crew members and scientific personnel formed a passing chain to help load frozen, refrigerated, and fresh stores onto the Neil Armstrong. The process was amazing! Everyone worked as an oiled machine as the galley quickly filled with boxes upon boxes of assorted goods. Our second mate, Chrissy, worked as fast as she could to fit these boxes jenga-style into a food elevator to put them into the ship’s massive freezer/refrigerator.

We began our journey across the Atlantic! We were on the boat by 9 am and met for a team meeting and safety training at 10 in the main lab. The 1st mate, Chris, explained the protocols for fire and abandoned ship. Ayden demonstrated how to don a life-saving wetsuit. It’s not very complicated after you’ve been shown how to do it (I also had to try mine). I was just a half inch too tall for a small- apparently, they’re made for people exactly 5’4 and under. The next size up must be made for people about eight feet tall because I was practically swimming in it. One must lay this suit on the floor to climb into it, one limb at a time. Chrissy, the third mate, helped me get my arms and legs inside. The suit may be zipped up past one’s chin and a strap is placed over the lower part of one’s face. The final step is to squeeze all the air out by crouching and hugging one’s knees. The suits are enormous and clunky beyond imagination, but life-saving in an emergency.

At noon precisely, the boat was pushed away from the dock and we all waved goodbye to those we were leaving behind on land. Following departure, we did drills for emergencies. For a fire, everyone met in the main lab. For abandoned ships, top bunk people rendezvoused at the port side of our vessel and bottom bunk people convened at the starboard side. Later in the evening, the boat stopped for our first CTD cast! In hard hats, steel-toe boots, and bibs (foul weather gear, lacking the jacket), we undid the ratchet straps anchoring the CTD in place on the deck. A well-oiled crane picked the CTD up on a thick cable. The tension in the cable was visible via a screen well over our heads. The tension rapidly increased as the CTD was lowered over the water. We popped all of the Niskin bottles open on top and bottom. These “fired”- aka, closed- once the CTD reached the desired depth at 165 meters down.

The machine was then slowly pulled back to the surface on its cable and gently lowered onto the boat, dripping seawater. We quickly strapped it back to the deck. Then, we tested each bottle to be “leakers,” meaning it’s a Niskin that did close properly on the way up therefore, it’s bad water and can’t be used for science. We took samples for DOC (dissolved organic carbon) and POC (particulate organic carbon). Both involve rinsing the sampling bottle and cap out 3x, then filling to the top with seawater from the desired Niskin. Immediately after, in the lab, we practiced filtering both types of samples.

Photo: The author spends free time on the transit painting and drawing each day.

MSM129: St. Johns, Canada to Reykjavik, Iceland

The blog of the cruise can be found here (German & English): https://www.oceanblogs.org/msm129

Chief Scientist: Johannes Karstensen
Co-chief scientist: Fehmi Dilmahamod

    The journey begins

    Maria S. Merian in the harbour of Warnemünde (Photo: Abed Hassoun)

    It’s time for the Maria S. Merian to embark on the research mission MSM129. In the first part of this mission, the ship will cross the Atlantic—starting in Warnemünde and reaching St. John’s in Canada around 10 days later. In the second part, it will travel from St. John’s through the Labrador Sea to the tip of Greenland and then on to Reykjavik. This blog will accompany the research ship and its inhabitants throughout the journey, providing you with insights into the research and life on board.

    So let’s start with the first part of the journey and the question of what the goal of this research trip is.

    On every research trip, the respective research groups bring their own measuring devices that they need for their projects. At the same time, there are also devices permanently installed on the ship. Fixed sensors collect information about surface water temperature, salinity, and chlorophyll, as well as current speed. The German Marine Research Alliance (DAM) has made it its mission to preserve and make these underway data (so-called because they are measured while underway) long-term and sustainably usable for science and society. This includes, among other things, quality control and the provision of the data in near real-time.

    This expedition focuses on these underway data and has become the main reason for the research trip. The special aspect of this is that data management staff, who normally work from land, will join the scientists on site. The goal of the trip is to optimize the processing and provision of the underway data. Several institutes are involved in this task: MARUM in Bremen, Alfred Wegener Institute in Bremerhaven, the Institute for Baltic Sea Research in Warnemünde, the Institute for Chemistry and Biology of the Marine Environment in Wilhelmshaven and the University of Oldenburg, as well as the GEOMAR Helmholtz Center in Kiel.

    We left the port of Warnemünde on May 25th in the best weather. By now, we are already a bit further away from the coast and have experienced the first thunderstorms. Not all measuring devices are switched on yet—some cannot be used all the time and everywhere because, even on the water, national borders must be respected. On our way through the Kattegat, Skagerrak, and along the east coast of Great Britain, we cross several national waters. Only in international waters are we allowed to turn on all the measuring devices permanently.

    The FerryBox

    FerryBox (Photo: Christiane Lösel)

    Today we accompany Julia from the Institute of Marine Chemistry and Biology of the University of Oldenburg in her work on the Maria S. Merian. The last post was a bit about the underway data, which are measured on ships. Julia brought with her another device that also falls into this category: a FerryBox.

    The FerryBox is a so-called flow device. This means that water under the ship is sucked in with a pump and passed through the device. The instrument can then measure the temperature and salinity of the water. These two quantities are important because they determine the density of the water and thus provide information about currents. In addition, the device also measures bio-optical values, namely chlorophyll A and CDOM (Colored Dissolved Organic Matter). Chlorophyll provides information about how much phytoplankton is present in the water. Phytoplankton are small algae that form the basis of the entire marine food web. The great advantage of the Ferry Box is its modular structure. For example, sensors for total alkalinity (how much acid the water can bind), carbon dioxide or PH value can also be added.

    So these are all important variables for understanding processes in the ocean. But why is the device on board and where does the name FerryBox come from?

    Maybe we’ll start with the declaration of names. The FerryBox is meant to be used on ferries. Ferries are good for carrying measuring instruments, as they regularly travel the same distance. The FerryBox is a box-shaped device that can measure autonomously and only needs to be maintained by a scientist from time to time.

    The main objective of this first part of the research trip is to optimize the transmission of data from measuring instruments to land. The FerryBox can be seen as an example of this. Julia brought them aboard and, together with Norbert from the Alfred Wegener Institute, is now making sure that the data is transmitted to shore in near real-time. When she is back ashore in her office during the second part of the research trip, she can retrieve the data from her computer. If an error should occur, she can notify the ship directly so that the problem can be rectified immediately. Julia also calibrates the FerryBox. To do this, she passes water samples through a filter in the lab and then stores them in a refrigerator with a temperature of -80°C. This means that the samples remain stable until they are subsequently evaluated in a laboratory in Germany.

    In the end, the developed software should be usable as a blueprint for other devices. The near real-time data is then also publicly visible and can be used by anyone.

    Seamounts

    Scheme explaining the echo sounder (Damaske, 2013)

    If you go on a hike in the mountains, you usually look at a map as the first step. It is also important to have a map of the ocean. Not only a map listing the coasts and islands, but above all a detailed map of the topography of the seabed. During the middle of the 19th century to the beginning of the 20th century, depth measurement was still carried out with a weight at the end of a long rope, but today the echo sounder patented by Dr. Alexander Behm from Kiel in 1913 is used in most cases.

    The most accurate and scientifically recognized bathymetric data collection is produced by GEBCO (General Bathymetric Chart of the Oceans). The dataset is based on collected data from vessel depth measurements and was first presented to the public 120 years ago. Today, this data set consists largely of so-called predicated bathymetry. This means that satellite measurements are made, which can then be verified and supplemented with bathymetry measured by ships. The satellites can derive from the measured sea level via various physical relationships whether a seamount is underwater. This method allows us to map the entire ocean, but it is very inaccurate. Seamounts less than 2 km in size, for example, cannot be measured. The GEBCO dataset is now renewed every year. The only drawback is that it lacks detailed metadata. Metadata is background information indicating, for example, by which institute or on which vessel the data provided were measured.

    Since the data set is largely based on ship measurements, it is highly dependent on ship routes, some of which have very large gaps. Only about 20% of the seabed has been measured in this way (Mayer et. al 2018). On this journey, we want to map some of these gaps. More specifically, we want to map so-called seamounts.

    Seamounts are submerged mountains of volcanic origin. They are typically conical, often with craters, linear ridges or shallow peaks. The shape often depends on the origin of the seamount. They are formed in places where tectonic activity occurs, such as near oceanic ridges, arch islands, or at places where hot material rises from the Earth’s mantle beneath the tectonic plate. Seamounts that form near plate boundaries, i. e. where the lithosphere (the Earth’s crust and the outer part of the Earth’s mantle) is still fresh and thin, tend to be rather small. Small in this case means less than 2. 5 km altitude. Larger seamounts with a height of 3-10 km often form in places where the lithosphere is older and thicker. Although it is not known exactly how many seamounts there are, one thing is certain: there are many!

    Due to their volcanic origin, seamounts are very interesting from a geological point of view, as they can provide insight into the composition and temperature of the Earth’s mantle. Seamounts are also important for oceanographic observations, as bathymetry influences currents and mixing processes. Seamounts can act as barriers that prevent cold deep water from mixing with warm surface water. Finally, they are also the centre of a diverse ecosystem. This is because nutrient-rich deep water rises at their flanks (a process called upwelling) and thus forms the perfect basis for fish and diverse flora and fauna.

    So now we know why we should be interested in seamounts, that there are many of them out there, and that a lot of them have not yet been mapped.

    On our planned itinerary we pass some places where seamounts are suspected. By only slight course changes it is possible to drive over some of these seamounts and to measure them with the ship echo sounder. An acoustic signal is sent to the seabed, which is reflected on the ground and then received when returning to the ship. Thus, the measured time between sending and receiving can be used to measure the distance between the ship and the seabed. This principle is also used here on the Maria S. Merian, with the difference that not only one signal, but a whole range of signals is emitted. This allows a strip with a width of six times as large as the water depth to be measured. In our current measuring area the water depth is 2500-3000 m which corresponds to a mapped strip of 15 to 18 km wide.
    We are at the moment near the Mid-Oceanic Ridge, a place where new lithosphere is forming. As we have already learned, the seamounts to be found here will tend to be smaller. In this area, the number and density of predicted seamounts is also significantly higher. Our first mapped small seamount, still far from the Mid-Oceanic Ridge, showed a shallow peak with an approximate height of 450 m. With 7. 5 km wide and 8 km long, it was almost round and extremely worth seeing.

    Picture of a Seamount measured during this cruise

    On this trip, Daniel and Marianne from the “Underway” research data project of the German Marine Research Alliance (DAM) will take care of everything that has to do with the seamounts and the Multibeam Echo Sounder. Frequently, Multibeam data is collected even if the focus of the research is not in the measurement of the seabed. As part of the project, Daniel and Marianne worked to collect these data and make them available to scientists after the research trip. Both are part of PANGAEA, a data repository for earth and environmental data.

    Sources:

    • Gevorgian, J., Sandwell, D. T., Yu, Y., Kim, S.-S., & Wessel, P. (2023). Global distribution and morphology of small seamounts. Earth and Space Science, 10, e2022EA002331. https://doi.org/10.1029/2022EA002331
    • Mayer, L.; Jakobsson, M.; Allen, G.; Dorschel, B.; Falconer, R.; Ferrini, V.; Lamarche, G.; Snaith, H.; Weatherall, P. The Nippon Foundation—GEBCO Seabed 2030 Project: The Quest to See the World’s Oceans Completely Mapped by 2030. Geosciences 20188, 63. https://doi.org/10.3390/geosciences8020063
    • Damaske, D. (2013): Bathymetry and short term changes of submarine seafloor structures in the area of the former Larsen ice shelf, north west Weddel Sea, Master thesis, http://hdl.handle.net/10013/epic.67a7bbd6-5ada-4764-a961-519e334d5c56
    • https://oceanexplorer.noaa.gov/facts/seamounts.html

    Goodbye green, Hello deep ocean blue

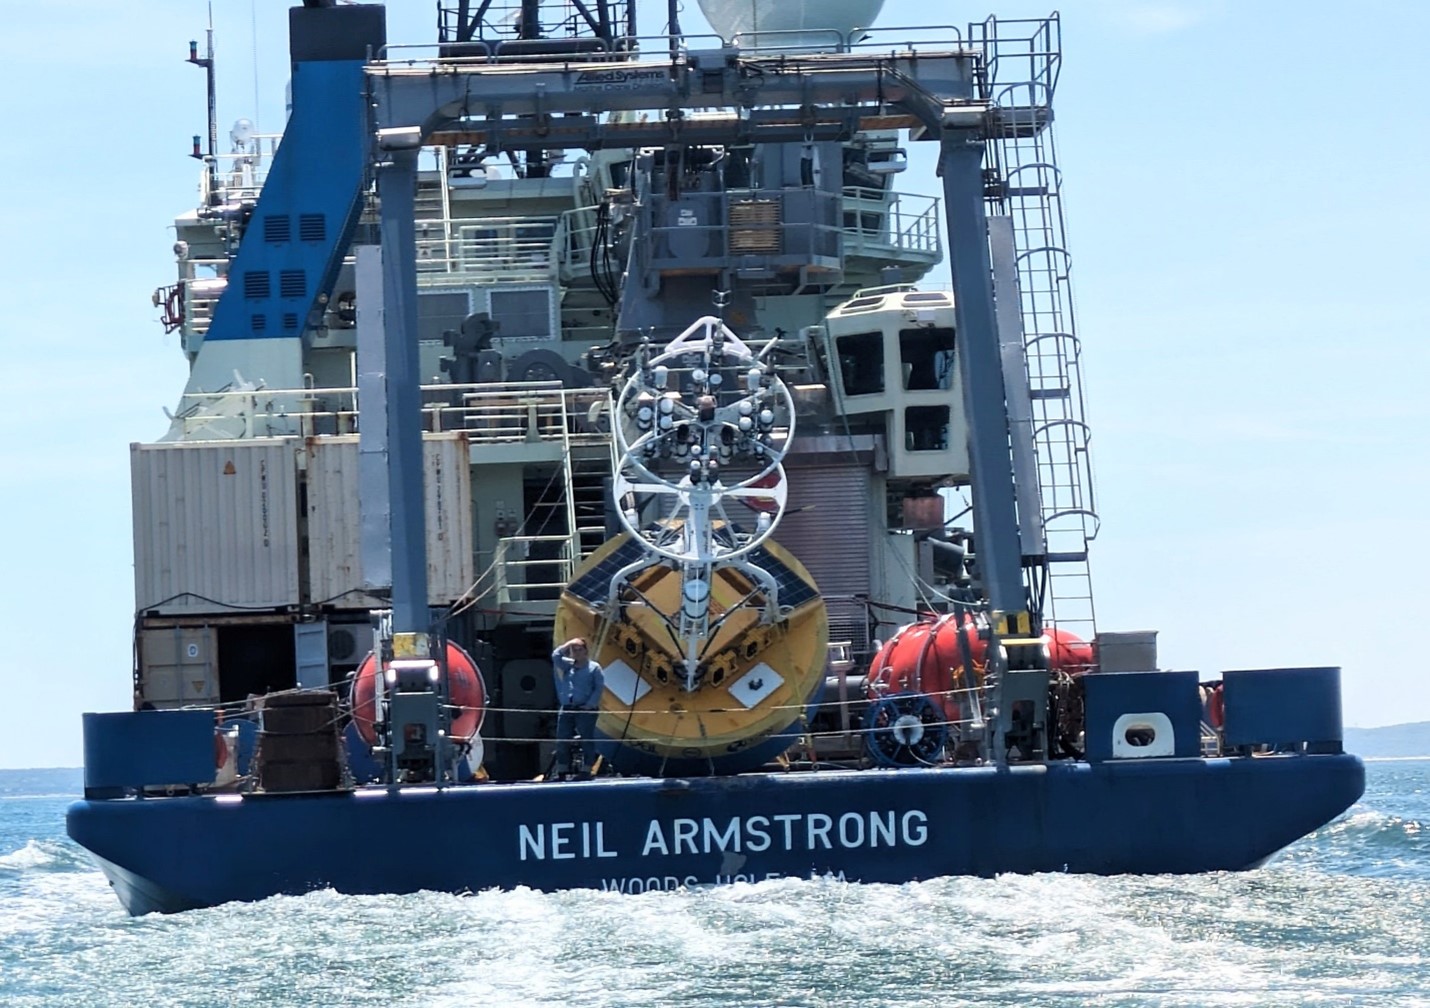
    By H Furey

    The 2024 OSNAP field season is underway. The R/V Armstrong departed her homeport of Woods Hole on 02 June 2024, loaded with gear, and bound for the Irminger Sea. The ship will spend the summer in the subpolar North Atlantic, in support of OSNAP and other science programs. The next time the Armstrong will be in home will be in November.

    Photo: I look out from the fantail as the R/V Neil Armstrong departs from Woods Hole.  Goodbye land, goodbye Cape Cod summer, goodbye green, goodbye flowers and nesting birds. See you in a while. (Photo by Dave Fisichella, WHOI.)

    I’m thankful to be with this crew, on this ship, and with this science party. It’s been a year since I’ve last been to sea, and then, in the Indian Ocean in support of a different project. Our OSNAP component is supported by Adam Houk (WHOI) and me, with help from Meg Yoder (Boston College). We travel with the NSF Ocean Observing Initiative (OOI) crew who are turning the Global Irminger Sea Array (https://oceanobservatories.org/array/global-irminger-sea-array/). The term ‘turning’ means to recover the moorings and instruments currently in the water and deploy new moorings with fresh instruments.  For the OSNAP portion of the cruise, we are turning the moorings east of the Greenland shelfbreak (OSNAP ‘GDWBC’ moorings M1, M2, M3, M4). OOI supports OSNAP in that two of the OOI moorings are inline with the OSNAP array, and the OOI mooring data are used in the OSNAP transport, heat, and freshwater calculations. We lean on the other science personnel and students onboard, who help mightily to get the OSNAP moorings recovered and re-deployed, instruments calibrated, CTD casts collected, water sampled and analyzed.  In turn, we help them as we can during their mooring and hydrography operations. We have a few more days of steaming north to deep water, and then the work begins.

    Photo: This year Harry Burnett, our Chief Steward, has a collection of ducks in the galley window.