Abstract: Changes in freshwater transport into the subpolar North Atlantic have the potential to disrupt or enhance the formation of dense water with subsequent impact on the meridional overturning circulation and associated ocean heat transport. Freshwater budget components in the subpolar North Atlantic include input from the atmosphere (precipitation vs evaporation, and river run-off), Greenland ice-sheet melt, saline subtropical water carried by the MOC, the dense overflow waters, and Arctic-origin freshwater carried by the shallow boundary currents that follow pathways west and east of Greenland. In this analysis we use a multi-decadal data set from the Labrador Shelf to characterise long-term variability in the transport of Arctic freshwater in the Labrador current. We first present evidence from an eddy-permitting global ocean circulation model to determine the origins of the water sampled by our time series. In particular we examine the dynamics of the currents on the Labrador Shelf in order to isolate the Arctic-origin water masses. We describe how we derive a 65-year record of changing Arctic freshwater transport from the observational data set. We will show that the multi-year changes in freshwater transport in the Labrador Current are consistent with independently-observed changes in subpolar freshwater storage.
Abstract: An international effort, Overturning in the Subpolar North Atlantic Program (OSNAP), is a partnership among oceanographers from the US, UK, Germany, the Netherlands, Canada and China whose goal is to measure and understand what drives the Atlantic Meridional Overturning Circulation (AMOC) and its variability. With high-resolution mooring arrays from the Labrador coast to the Scottish shelf, OSNAP provides a continuous record of the full water column, trans-basin fluxes of heat, mass and freshwater in the subpolar North Atlantic and has been operational since 2014. Data from the first 21 months of the full OSNAP observing system has been used to produce the first continuous time series of these variables. In addition to these time series, time mean estimates for all fluxes and attendant uncertainties will be presented, along with comparisons with other contemporaneous AMOC measurements and a discussion of subpolar overturning variability.
Abstract: The international observational program, OSNAP (Overturning in the Subpolar North Atlantic Program) began in the summer of 2014 for the purpose of recording continuous trans-basin observations of volume, heat and freshwater. OSNAP will investigate the complex interplay between AMOC and gyre circulation, air-sea fluxes and ocean heat and freshwater transport convergence which presently lack observational evidence. The OSNAP array uses moored instruments, gliders and floats to measure velocity, temperature and salinity along a section from Canada to Greenland to Scotland. Here we present detailed views of the full-depth properties and velocity field from two high resolution hydrographic sections along the OSNAP line taken at the start of programme in June-July 2014 and during mooring turnaround cruises in May-August 2016. We derive estimates of the meridional overturning and gyre circulation and their components of heat and freshwater flux, finding that while the overturning dominates the heat flux, the freshwater flux is predominantly carried by the gyre. We show a notable difference in the magnitude of the overturning circulation and the heat and freshwater fluxes as measured by the two synoptic sections, and discuss how this relates to the associated differences in temperature, salinity and density fields.
Abstract: Since 2014, an array of current meters deployed as part of the OSNAP trans-basin observing system has provided new measurements of the southward flow of Iceland-Scotland Overflow water (ISOW) along the eastern flank of the Reykjanes Ridge in the Iceland Basin. The location of the array, near 58°N, captures the ISOW Deep Western Boundary Current at the farthest downstream location in the Iceland Basin before significant amounts of ISOW can flow into the Irminger Basin through deep fractures in the Reykjanes Ridge. The transport of the ISOW plume at this location – based on the first two years of OSNAP observations (July 2014 to July 2016) – is 5.8 ± 0.9 Sv for ?? >27.8. Most of this transport is carried in a main branch of the plume along the upper ridge crest in depths from 1400-2200 m. A secondary branch in depths of 2400-2700 m along the lower ridge crest carries about 1 Sv. The transport of the ISOW plume varies over a considerable range, from about 2-10 Sv on weekly to monthly time scales (std. dev. = 2.4 Sv); however the mean currents from two individual year-long deployments are very similar and indicate a robust mean flow structure. Watermass analysis of the plume from continuous temperature/salinity measurements shows that about 50% of the plume transport (2.6-3.0 Sv) is derived from pure Norwegian Sea Overflow waters (NSOW) – consistent with the amount of NSOW known to be flowing over the northern sills into the Iceland Basin – while the remainder is made up of approximately equal parts of entrained Labrador Sea Water and modified Atlantic thermocline waters. The observed ISOW transport at this location is larger by almost 2 Sv than previous values obtained farther north in the Iceland Basin, suggesting that either additional entrainment into the ISOW plume occurs as it approaches the southern tip of the Reykjanes Ridge, or that the previous measurements did not fully capture the plume transport.
Abstract: The “null-hypothesis” for sea surface temperature (SST) variability is that the ocean mixed layer integrates stochastic atmospheric forcing, leading to red SST spectra. According to this hypothesis, decorrelation timescales (e.g., e-folding timescales) of SST are a function of the mixed-layer depth (MLD) and the damping parameter. In this work we evaluate the ability of the null-hypothesis to explain interannual SST variations in the extra-tropical North Atlantic and North Pacific. First, we develop an idealized red-noise model of the mixed layer heat balance in the North Atlantic, in which the oceanic contribution is neglected in order to isolate the effects of atmospheric forcing. We evaluate the e-folding timescale in this model using observational datasets. Results suggest that in both the North Atlantic and the North Pacific, e-folding timescales depend strongly on the mixed layer depth, but the relationship is stronger in the North Atlantic. Then, we use gridded ocean temperature observations to directly calculate the decorrelation timescales for both SST and upper-ocean heat content and compare these timescales to those predicted by our theoretical model. Regions where decorrelation timescales differ significantly from those predicted by our theoretical model indicate the importance of processes other than local atmospheric forcing, including reemergence of SST anomalies, ocean dynamics, and/or external forcing.
Abstract: The North Atlantic undergoes swings in sea-surface temperature (SST) on multidecadal timescales, with consequent impacts on the climate of adjacent land areas. Proposed mechanisms behind this Atlantic Multidecadal Variability (AMV) fall into two main categories: external forcing e.g. due to anthropogenic aerosols; or internal modes of variability e.g. involving the Atlantic Meridional Overturning Circulation (AMOC). In either case the relationship between the changes in oceanic heat transport and the SST is not well understood. Here we develop a framework to investigate which physical processes determine SST variability on decadal to multidecadal timescales by evaluating contributions from the net ocean-atmosphere heat flux, the divergence of the temperature transport, and entrainment between the mixed layer and the layer beneath. We analyse the 300-year present-day control simulation of the HADGEM3-GC2 coupled climate model, which shows a 20-30 year AMV variability similar to that observed.
We find that the AMOC leads the AMV by ~5 years. The model suggests that a key process connecting the AMOC to the AMV is heat transport divergence into/out of the mixed layer. AMOC changes themselves are preceded by changes in the eddy heat transport divergence in the deep ocean on times scales of ~12 years.
Abstract: Recent studies have shown that a thermohaline coordinate system can be used to simplify the complex spatial structure of the global ocean circulation with minimal loss of information (e.g. Zika et al 2012, Groeskamp et al 2014). This thermohaline framework is particularly useful in studying the fluxes of heat and freshwater within the ocean, such as those associated with the AMOC.
In contribution to OSNAP we have developed a novel inverse method in thermohaline coordinates called the Regional Thermohaline Inverse Method (RTHIM). For a control volume, RTHIM invokes a balance between advection into the volume, fluxes of heat and freshwater through the surface, and interior mixing within the volume. Taking known surface fluxes and temperature-salinity distributions, RTHIM determines unknown section velocities and rates of interior mixing.
Using a 20-year mean of NEMO model data from 1988-2007, we have validated RTHIM for an Arctic control volume bounded to the south by a section at around 60°N by comparing section transports and interior mixing rates from the inverse solution with those diagnosed from the model. We find that the RTHIM solutions are robust to various model parameters and initial conditions. The MOC, heat and freshwater transports calculated from the RTHIM solutions are within 15%, 11% and 8%, respectively, of the NEMO ‘truth’. We also see good agreement between mixing rates obtained from the RTHIM solution and those diagnosed from the model.
Our aim is to construct a domain bounded by the OSNAP line and Bering Strait, and apply RTHIM to observations from satellite altimetry, gridded Argo and a selection of surface flux products. From this we can obtain independent estimates of the AMOC at the array, and mixing rates within the Arctic and Subpolar North Atlantic basins. Since these products extend 20 years before the OSNAP observations, our analysis will help contextualise the AMOC variability measured by the array and assess the significance of trends.
Posters Session:
Tuesday, February 13, 2018; 4:00 PM – 6:00 PM
Oregon Convention Center; Poster Hall
Abstract: While it has generally been understood that the amount of deep water formed in the Labrador Sea (LSW) impacts the meridional overturning circulation (MOC), this relationship has not been validated against observations. A current observational program (Overturning in the Subpolar North Atlantic Program: OSNAP) is aimed at ascertaining this linkage, but it will be a few years before this observational time series has sufficient degrees of freedom to evaluate the necessary correlations on time scales exceeding the annual. For now, we turn to a suite of global ocean and ocean–sea-ice models, varying in resolution from non-eddy-permitting to eddy-permitting (1°–¼°), to investigate the local and downstream relationships between the LSW volume and the MOC on interannual to decadal time scales. Simulated measures of the LSW volume changes and MOC variability are compared to available observational measures. In this presentation, we show that all models display a strong relationship between the LSW volume changes and the local overturning variability within the Labrador Sea, but this relationship degrades downstream. However, there are some differences among the models in their representations of these relationships.
Abstract: The meridional heat flux in the subpolar North Atlantic is pivotal to maintaining a relatively warm climate in Northern Europe. Much of the variability in the basin-wide northward heat flux between Greenland and Scotland occurs in the Iceland Basin (east of the Reykjanes Ridge and west of the Rockall Plateau), where the North Atlantic Current (NAC) carries relatively warm and salty water northward. As a component of the Overturning in the Subpolar North Atlantic Program (OSNAP), WHOI-OUC jointly deployed gliders in the Iceland Basin to continuously monitor the circulation and corresponding temperature flux associated with the NAC. In-situ observations indicate two circulation regimes in the Iceland Basin: a mesoscale eddy like pattern and northward flowing NAC pattern. When a mesoscale eddy is generated, the rotational currents associated with the eddy lead to both northward and southward flow in the Iceland basin. This is quite different from the broad northward flow associated with the NAC when there is no eddy. The transition between the two regimes coupled with the strong temperature front in the Iceland basin can modify the meridional temperature flux on the order of 0.3PW. The dramatic variability induced by alternating eddy and frontal patterns is also found in high-resolution (1/12°) HYCOM simulations. In addition, a separation of large scale and mesoscale processes in the model results suggests that eddies in the Iceland Basin make significant contributions to the variability of the total basinwide poleward heat flux on time scales from subseasonal to interannual.
Wednesday, February 14, 2018 – Location: A107-A109
Abstract: The Gulf Stream has been characterized as either a barrier or blender to fluid transfer, a duality relevant to gyre-scale climate adjustment. However, previous characterization depended on relatively sparse, Lagrangian in-situ observations. The finite-time Lyapunov exponent (FTLE) is calculated from satellite altimetry to identify Lagrangian coherent structures (LCS) in the Gulf Stream region. The focus here is on the transient and intermittent behavior associated with eddy propagation and eddy-jet interaction over timescales of a few days, in contrast to other studies characterized by longer integration times. These LCS provide dense sampling of flow, capture dynamically-distinct regions associated with transport and mixing, and even represent some flow structure at finer spatial scale than the observational grid. Independent satellite observations of ocean color contain similar flow-dependent structures, providing verification of the method and highlighting transport and mixing processes that influence sea surface temperature and chlorophyll, amongst other water properties.
Diagnosed LCS support the existing Bower (1991) kinematic model of the Gulf Stream, but also highlight many new processes of comparable importance. These include vortex pinch-off and formation of spiral eddies, clearly identified by LCS, and which may be explained by considering changes to flow topology and the dynamics of shear-flow instability at both small and large Rossby number. Such processes, seen though LCS, may enhance validation of climate models.
The spatial distribution of these intermittent processes is characterized in terms of the criticality of jet dynamics with respect to Rossby wave propagation, and whether the jet is in an unstable or wave-maker regime. The generation and connectivity of hyperbolic fixed points in the flow appear to play an important role in governing large-scale transport and mixing across the Gulf Stream.
Posters Session:
Wednesday, February 14, 2018; 4:00 PM – 6:00 PM, Oregon Convention Center; Poster Hall
by Doug Wallace, Dalhousie University and Brad deYoung, Memorial University
The Labrador Sea, off the east coast of Canada (see figure), is one of the few places where the deep ocean exchanges gases such as oxygen and carbon dioxide (CO2) directly with the atmosphere. Localized deep convection releases large amounts of heat to the atmosphere and the resulting Labrador Sea Water contributes to the global ocean thermohaline circulation that redistributes heat from low latitudes to the poles. Transport out of the Labrador Sea carries oxygen and anthropogenic CO2 into the North Atlantic interior, oxygenating subsurface layers and slowing the accumulation of CO2 in the atmosphere, but exacerbating ocean acidification along Canada’s sensitive eastern continental margin. The combined action of convection and horizontal circulation redistributes nutrients and contaminants (e.g. from future deepwater oil production along the deep Labrador slope) potentially affecting ocean productivity and marine ecosystem health.
In early November scientists from both sides of the Atlantic travelled to the National Oceanography Centre in Southampton, UK to spend two days discussing new
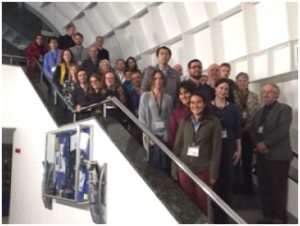
The OSNAP and OOI scientists at the 2017 Irminger Sea Regional Science Workshop, 8-9 November 2017, hosted by the National Oceanography Centre, UK.
findings and future research. The 2017 Irminger Sea Regional Science Workshop was designed to give us time to present results from recent observations from OSNAP and the Ocean Observatories Initiative (OOI http://oceanobservatories.org/), and to develop plans for collaborative analyses, publications and sampling strategies.
Workshops are less formal than conferences, and because this workshop was limited to less than 40 people there was much opportunity for conversation between all the participants. We had a good mixture of established and early career scientists, and for me that meant a chance to meet some new people, and to get to know better some people I’d met only briefly at previous OSNAP meetings.
We spent the first day sharing short talks on our analyses – and often these were presentations of preliminary results, giving the meeting an air of excitement. Each talk prompted lots of questions as we related our own findings to those up on the screen in front of us. The discussions spilled over into breaks and many people commented to me about how useful those conversations have been to them – this is the reason why we hold these workshops.
Some highlights among the talks were from OSNAP scientists – there isn’t room to list them all here, but here are a selection. Bob Pickart opened the talk session by showing us early results from his array west of Greenland – describing rapidly passing deep cyclones that may originate east of Greenland, and telling a great story about an instrument being torn off a mooring by ice, which was transported by the iceberg for a while before being found and returned by fishermen. Femke de Jong showed very interesting differences in variability at 3 closely-located mooring sites, concluding that controls on variability can change over small spatial scales. Johannes Karstensen presented some fascinating maps of mid-depth circulation derived from Argo float displacements, highlighting narrow and fast routes for exchange between the Labrador and Irminger Seas. Amy Bower, giving her talk remotely from the US, showed us more lagrangian information – this time intriguing tracks from floats that stay within the dense overflow layers and create a pattern of pathways quite different to our schematic maps. Isabela LeBras is exploring the slightly different seasonal cycles revealed by OSNAP moorings in the East Greenland Coastal Current and it’s larger offshore neighbour the East Greenland Current, and Peigen Lin showed us how the the inner current evolves as it travels around Cape Farewell. We finished the talks with a session on biogeochemical measurements on moorings, floats and gliders, and how changes in physical processes can impact ecosystems, reviving for some of us the idea that it would be very beneficial to build a biogeochemical programme associated with OSNAP.
The second day was even more interactive. We started by brain-storming ideas for research, writing down any science questions that came to mind: big, small, obvious questions, crazy ideas. We grouped them into themes and those became the topics for small breakout groups for the rest of the day. This brought people with common interests together and encouraged everyone to share their thoughts and ideas. Our discussion groups were: biogeochemical and physical interaction, boundary processes and exchange with the interior, air-sea interaction, convection and re-stratification, ice and freshwater, and large-scale connectivity. We came away from this day’s work with new ideas, plans for new collaborative papers, and some new networks of scientists interested in specific topics.
The conversations we started at this workshop will continue online and at future science meetings, and hopefully another workshop in a few years time.
A team of scientists from across the country is studying how the ocean breathes. They are studying the exchange of gases, carbon dioxide and oxygen, in the Labrador Sea, one of the few places in the planet where water sinks deep into the ocean carrying these gases with it. The scientists are part of a team working on an NSERC-funded CCAR project called VITALS – Ventilations Interactions and Transports Across the Labrador Sea http://knossos.eas.ualberta.ca/vitals/. They have put together a video to describe how the ocean breathes.
This research buy soma online combines new observations and modelling to determine what controls the exchange of these gases and how they are linked to and interact with the climate system. This video explains how the deep ocean connects with the atmosphere and the role of this deep breathing in climate change. The leaders of this program are Paul Myers (University of Alberta), Roberta Hamme (University of Victoria), Jean-Eric Tremblay (Université Laval), Jaime Palter (University of Rhode Island), Doug Wallace (Dalhousie University) and Brad deYoung (Memorial University.
I have been in Edmonton for almost ten years (PhD study and then postdoc of University of Alberta). When I tell people I am studying (physical) oceanography, they always laugh at me. I wish I had a perfect answer when they ask me “Why are you studying the ocean here? There is no ocean in Edmonton.” Physical Oceanography sounds strange to most, so I always “hide” the physical part in the name.
Well, there are too many things I can’t explain to them well enough. I count myself as an oceanographer but I don’t swim. Actually I prefer to move upward as I do climbing …. My friends joked that that I am preparing for the sea level changes. We know the sea level changes slowly, so one step higher might be the most efficient way (selfish though) to step away from the sea level rising problem.
With very little experience at sea, I am working with computers most of the time. Yes, I am one of them, the mysterious numerical ocean modellers. I have been working with the NEMO model (same name of the famous little fish) for years. To be more specific, I mainly do simulations with a regional configuration called ANHA. Someone once asked, “Is ANHA your girlfriend?” Of course, he was joking. ANHA stands for the Arctic Ocean and Northern Hemisphere Atlantic configuration. However, he was also right. To me, when you opt to sacrifice your personal time on one thing, it could be love; otherwise, it is just a one-way “benefit friendship”.
Sorry for drifting too far away, which is also a common problem in numerical modelling. Let’s pull it back to the ocean. My concern of the ocean is the salt. Life needs more salt, however, an ocean modeller may not agree because more salt leads to the model drift, particularly in the high latitude, which makes people feel bad for models.
However, sometimes, it is not necessarily the fault of the model itself. The ocean is thirsty. If there is little river discharge and rain, the Arctic Ocean and Atlantic Ocean salinity could look something like figure 1.
Figure 1 Simulated Sea Surface Salinity (SSS) with little freshwater into the ocean
Well, let’s feed the ocean with a reasonable amount of river discharge and precipitation, and the ocean looks much better (figure 2).
Figure 2 Simulated SSS with realistic freshwater into the ocean
Look (figure 2), can you see the freshwater plumes from the the big rivers? I was very excited to “see” these rivers showing up in the simulation. Meanwhile, a picky person like you may also notice the fresh water around southern Greenland. Yes, we can assume Greenland is just a rock island in the model. But we know the Greenland Ice Sheet (GrIS) is melting and feeding the surrounding ocean with a large amount of freshwater. Here we must give Jonathan Bamber credit for his freshwater estimates from the Greenland Ice Sheet.
The ocean is pretty happy with the freshwater from Greenland, thus, it is willing to tell us more about her, even the secret pathway of the Greenland meltwater (figure 3).
Figure 3 Vertical integrated (whole water column) of the Greenland meltwater passive tracer
Not a big surprise, it agrees with the general ocean circulation in this region as we know it. However, did you ever think about the spatial distribution, e.g., how much is accumulated in Baffin Bay and how far it can go down to south along the east coast of North America? The models do tell people something that is hidden behind what we see.
In the end, a nice story was made, but still, there is no ocean in Edmonton….
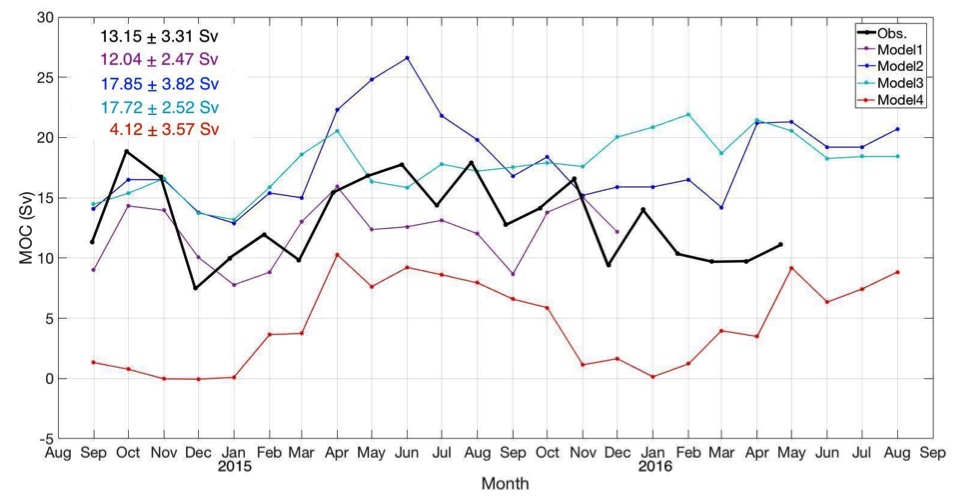
In the summer of 2016, the OSNAP team collected data from the full array for the first time. Prior to publishing the first estimate of the meridional overturning circulation (MOC) this coming fall, we invited the ocean community to predict the overturning variability at the OSNAP line. Four groups entered this OSNAP challenge by submitting predictions from September 2014 (initial deployment of the OSNAP line) to August 2016. This OSNAP challenge was certainly challenging given that there were no previous OSNAP data from which to base the predictions. As such, we are grateful to the modelling community for participating in such a speculative activity.
Results
A preliminary analysis from OSNAP yields a mean MOC of 13.15 Sv with a standard deviation of 3.31 Sv during the 21-month period for September 2014 – May 2016. All predictions are shown in Figure 1. We assessed the accuracy of each prediction by both the root-mean-square-error (RMSE) from the observed time series and its temporal correlation (r) with the observed time series.
Table 1. Skill of the four predictions, ranked according to RMSE.
Model #
Group
RMSE (Sv)
Correlation (r)
1
Ben Moat (NOC, UK)
3.30
0.59
2
Laura Jackson (Met Office, UK)
5.87
0.50
3
Charlène Feucher (University of Alberta, Canada)
6.34
-0.14
4
Andrea Storto (CMCC, Italy)
9.86
0.33
Mean of predictions
6.34
Winner
Ben Moat and his group from the National Oceanography Centre (NOC) in Southampton, UK won the competition with the lowest RMSE and highest correlation. Congrats to Ben and his colleagues! For their efforts they will receive the grand prize of OSNAP T-shirts!
Figure 1. The MOC time series for 2014-2016. The black line shows the observational time series. Colored lines show the four entries (ranked according to RMSE). Numbers in the upper left hand corner indicate the mean MOC plus/minus one standard deviation for each of the submitted time series. Note: Instrument failures near the end of the two-year deployment limited the OSNAP observational estimate to 21 months (September 2014 – May 2016).
More on the prediction
If you would like to know more about how each prediction was made, here are links to blog entries by some of the participants:
[1] OSNAP Challenge by Charlène Feucher, University of Alberta
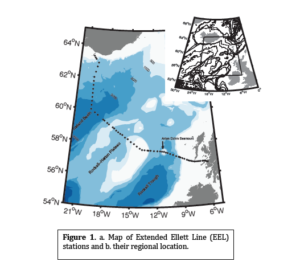
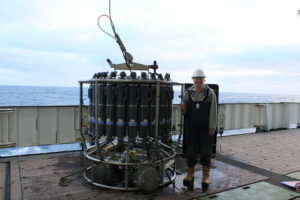
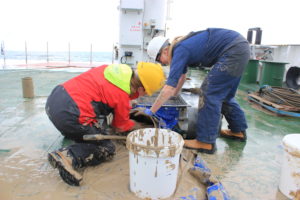
In my last blog a year ago I mentioned I would be going to sea for the Extended Ellett Line (fig. 1) annual research cruise, which is part of the OSNAP array. I boarded the RRS Discovery during June and we steamed towards Iceland, where we started sampling at each CDT station whilst heading back to Scotland. During this cruise I focussed mainly on the ADCP measurements and processing, as I was going to start using it within my research and this was the perfect way to get familiar with it. I had a brilliant time on this cruise, as the photos hopefully depict (fig. 2, 3 and 4), and it was a great insight to Oceanography in the field.
Now onto how this data will aid my research. The aim of my current research is to investigate the long-term mean and variability in volume, freshwater and heat transport of the Subpolar North Atlantic. All the hydrographic and velocity measurements collected annually are used to compute these transports, providing a near 20-year timeseries. It is important that we take continuous measurements at this location and compute these transports as 90% of the Atlantic inflow into the Nordica Sea and Arctic takes place between Iceland and Scotland, as well as roughly half the returning buy levitra online dense water. This research will add to our knowledge of how the Meridional Overturning Circulation in the Subpolar Atlantic is varying on a decadal to seasonal timescale, and add insight to the mechanisms controlling it. This observational data also enables the enhancement of oceanic models to produce transport variabilities on longer timescales.
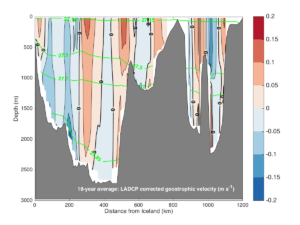
The research into the long-term transport that has been carried out with my Supervisors Dr Penny Holliday and Prof Sheldon Bacon will be published in the near future, but below is a taster of the 18-year (1997-2015) mean Lowered-ADCP velocity across the section (fig. 5). This data is used to produce the long-term absolute velocity by providing a reference velocity for the geostrophic velocity field, which the transports are computed from. In this study I investigate how the transport varies across the region, highlighting the key routes for transport and why it is important we know this. Furthermore, the Scottish Continental Slope Current that runs northward along the Scottish shelf edge and the Rockall-Hatton Bank have the highest temperatures and salinities of the region. Hence, I hypothesis that these are fundamental routes for heat transport northward.
Monday, 24 Apr 2017
The North Atlantic: natural variability and global change (co-organized)
OS1.2/AS1.20/CL1.29
Oral Presentations: Location: Room D2
On the Nature of the Mesoscale Variability in Denmark Strait
Robert Pickart, Wilken von Appen, Dana Mastropole, Hedinn Valdimarsson, Kjetil Vage, Steingriumur Jonsson, Kerstin Jochumsen, and James Girton
EGU2017-5372
09:00-09:15 View Abstract
OSNAP Update: Measuring the AMOC in the subpolar North Atlantic
M Susan Lozier
EGU2017-10341
10:30–10:45 View Abstract
Overflow Water Pathways in the Subpolar North Atlantic Observed with Deep Floats
Amy Bower, Heather Furey, and Susan Lozier
EGU2017-8103
11:00–11:15 View Abstract
Observed and Modeled Pathways of the Iceland Scotland Overflow Water in the eastern North Atlantic
Sijia Zou, Susan Lozier, Walter Zenk, Amy Bower, and William Johns
EGU2017-9794
11:15-11:30 View Abstract
Transport of Iceland-Scotland Overflow waters in the Deep Western Boundary Current along the Reykjanes Ridge
William Johns, Adam Houk, Greg Koman, Sijia Zou, and Susan Lozier
EGU2017-9415
11:30–11:45 View Abstract
Gulf Stream transport and mixing processes via coherent structure dynamics
Chris Wilson, Yi Liu, Melissa Green, and Chris Hughes
EGU2017-10345
14:00–14:15 View Abstract
Transport Structure and Energetic of http://buylexaprousa.com the North Atlantic Current in Subpolar Gyre from Observations
Loïc Houpert, Mark Inall, Estelle Dumont, Stefan Gary, Marie Porter, William Johns, and Stuart Cunningham
EGU2017-5593
14:30–14:45 View Abstract
Poster Presentations
Location: Hall X4
Time: 17:30–19:00
Volume, heat and freshwater transport in the Irminger Current
M. Femke de Jong, Laura de Steur, Stelios Kritsotalakis
EGU2017-9635
X4.28 View Abstract
Assessing variability in the size and strength of the North Atlantic subpolar gyre
Nick Foukal and Susan Lozier
EGU2017-10141
X4.6 View Abstract
Transport and seasonal variability of the East Reykjanes Ridge Current
Greg Koman, Adam Houk, Cobi Christiansen, and Bill Johns
EGU2017-8490
X4.43 View Abstract
On the Linkage between Labrador Sea Water Volume and Overturning Circulation in the Labrador Sea
Feili Li and Susan Lozier
EGU2017-9776
X4.48 View Abstract
Application of a Regional Thermohaline Inverse Method to observational reanalyses in an Arctic domain
Neill Mackay, Chris Wilson, and Jan Zika
EGU2017-17329
Poster: X4.60 View Abstract
The AMOC as a mechanism for nutrient supply to the Eastern North Atlantic
Ryan Peabody and Susan Lozier
EGU2017-17315
X4.56 View Abstract
Gyre scale deep convection in the subpolar North Atlantic Ocean during winter 2014-2015
Anne Piron, Virginie Thierry, Herlé Mercier, and Guy Caniaux
EGU2017-10183
X4.49 View Abstract
Circulation in the region of the Reykjanes Ridge in June-July 2015
Petit Tillys, Mercier Herle, and Thierry Virginie
EGU2017-13328
X4.25 View Abstract
Tuesday, 25 Apr 2017 Room: G2
Mesoscale eddies control meridional heat flux variability in the subpolar North Atlantic
Jian Zhao, Amy Bower, Jiayan Yang, Xiaopei Lin, and Chun Zhou
EGU2017-17050
09:15-09:30 View Abstract
In October 2014 I started my PhD at GEOMAR and Kiel University. I was coming from KIT (Karlsruhe Institute of Technology ), where I studied experimental and theoretical physics and worked on cloud microphysics for a year as part of my diploma (masters) thesis. Before I started my diploma thesis I got the chance of an internship at Alfred-Wegener Institute and worked on quality control of some old cruise data from RV POLARSIRKEL in 1980/81, which was a great experience. I had a lot of fun during these three months at AWI while getting to know this new field of ocean physics. So when I was looking for a PhD after this internship I was intrigued by the general topic of deep-water formation in the northern and southern hemisphere. When I started at GEOMAR this idea quickly evolved into a more focused study comparing a high-resolution ocean model (VIKING20) with observations from the 53°N array. This boundary current observatory is maintained by Kiel scientists since 1997 to document the changes of the deep-water circulation in the Subpolar North Atlantic (SPNA).
My main research question is: What are processes imprinting variability to the deep-water masses in the SPNA, where do they occur and what are the physics behind them.
But lets start with some background information …
The exit of the Labrador Sea is a key location in the subpolar North Atlantic concerning the integral quantities of the Deep Western Boundary Current (DWBC). It is the place where deep water masses from different origins and pathways meet. The combination of these is collectively called North Atlantic Deep Water (NADW).
To evaluate the high resolution model VIKING20 by means of integral quantities at the exit of the Labrador Sea, and to interpret the observed hydrographic and dynamic DWBC features with consideration of the underlying physical processes and forcing is the aim of my work.
I found that the VIKING20 model, which is driven by CORE2 atmospheric forcing, can be nicely compared to more than decade-long observations at the exit of the Labrador Sea near 53°N. VIKING20 is a high resolution (1/20°) nest, based on the global configuration of the NEMO-LIM2 ocean-sea ice model ORCA25 in the North Atlantic and implemented by two-way nesting (Behrens [2013];Böning et al. [2016]). The average flow field, being one of the integral quantities of the boundary current at 53°N including the bottom flow-intensification, is reproduced by VIKING20 (figure 1).
Figure1: Mean velocity field computed from LADCP and mooring data from 53°N (left) (Fischer et al. [2010]) and the mean velocity field of the full resolution Model section at 53°N for the period from 1958 till 2009 (right).
Although circulation and recirculation is stronger and more barotropic in the model than in the observations the overall transport at 53°N including both circulation and recirculation coincides with the observed transport of NADW of ~30 Sv (Zantopp et al. [2017]). Is the model, apart from its challenges in hydrography and hence different baroclinicity, still reproducing variability imprinting processes on Labrador Sea Water (LSW) and the lower North Atlantic Deep Water (LNADW)?
Figure 2: Transport time-series of observations at 53°N, already published in Zantopp et al. [2017] with overlaid low pass filtered model transports of LSW (top) and LNADW (bottom).
In both model and observations the low pass filtered time series are less correlated than the high frequency containing raw transport signal. This could be interpreted as reproduction of low frequency variability imprinting processes that are reproduced by the model.
But pursuing a PhD in Physical Oceanography does not only include programming and working on data in an office, it is also hands on ship work. Hence I was also able to gain some subpolar and Labrador Sea experience during the cruise MSM54 from St. Johns to Reykjavik from mid May to June 2016. On this cruise I could see and experience the Labrador Sea. We exchanged the mooring array at 53°N and did a high resolution hydrographic survey to maintain the high quality and dense coverage of data in the Labrador Sea. Furthermore moorings in the central Labrador Sea, Irminger Sea and near the west Greenland shelf break where renewed. Knowing what the problems and powers of observational oceanography in this region are is helping me a lot in understanding challenges in my model – observation comparison process.
My current work focuses on the low frequency variability in the model and the observations. Some of the exciting findings will be published soon.
The processes causing this variability are still subject to ongoing research.
Bibliography
Behrens, E. (2013), The oceanic response to Greenland melting: the effect of increasing model resolution, Kiel, Christian-Albrechts-Universität, Diss., 2013.
Böning, C. W., E. Behrens, A. Biastoch, K. Getzlaff, and J. L. Bamber (2016), Emerging impact of Greenland meltwater on deepwater formation in the North Atlantic Ocean, Nature Geoscience.
Fischer, J., M. Visbeck, R. Zantopp, and N. Nunes (2010), Interannual to decadal variability of outflow from the Labrador Sea, Geophysical Research Letters, 37(24).
Zantopp, R., J. Fischer, M. Visbeck, and J. Karstensen (2017), From interannual to decadal—17 years of boundary current transports at the exit of the Labrador Sea, Journal of Geophysical Research: Oceans.
In the past a few months, I have been working on identifying the spreading pathways of Iceland Scotland Overflow Water (ISOW) in the eastern North Atlantic, with focus on its southward spreading along the eastern flank of the Mid-Atlantic Ridge (MAR).
The ISOW is formed in the Nordic Seas and overflows into the Iceland basin over the sill between Iceland and Scotland. Together with the Denmark Strait Overflow Water (DSOW) that overflows via the sill in Denmark Strait, and the Labrador Sea Water (LSW) formed in the Labrador Sea, these deep waters make up the lower limb of the Atlantic Meridional Overturning Circulation (AMOC). An understanding of the spreading pathways of these deep water masses is fundamental to our understanding of AMOC structure.
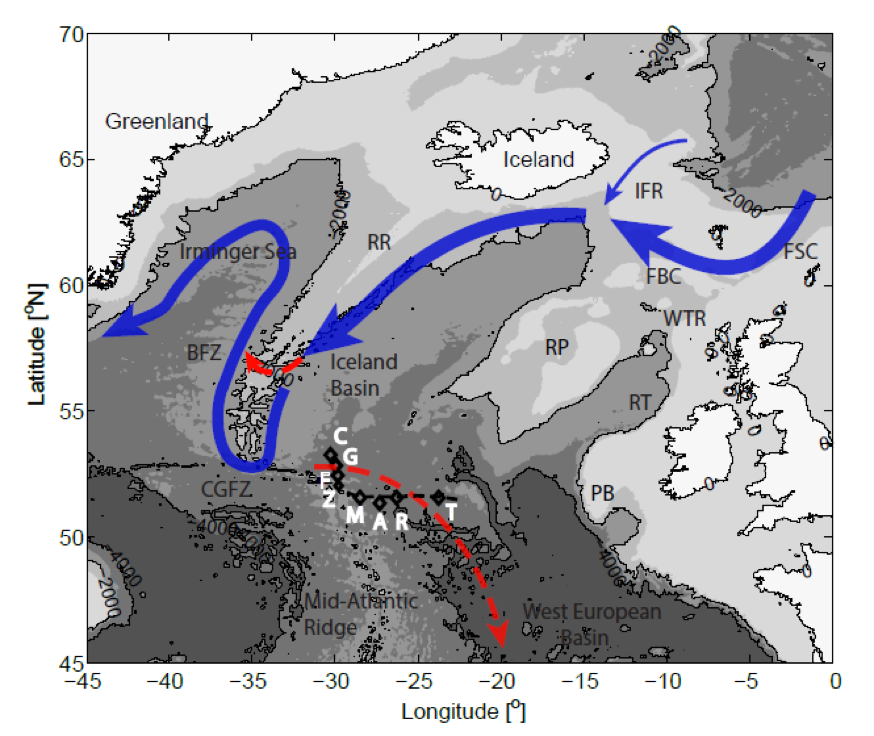
Traditionally, the Deep Western Boundary Current (DWBC) was considered the major conduit from the subpolar to the subtropical gyre for these deep water masses: ISOW travels cyclonically in the Iceland basin within the DWBC, enters the western subpolar gyre via the Charlie-Gibbs Fracture Zone (CGFZ) (see Figure 1, solid blue curve) and joins the DSOW and LSW in the DWBC in the western basin.
However, recent studies question the DWBC’s representativeness of the lower limb of the AMOC. In the western North Atlantic, where all the three deep water masses are present, Lagrangian floats and model simulations reveal interior pathways of the deep waters from the subpolar gyre to the subtropical gyre (Bower et al., 2009; Gary et al., 2012; Lozier et al., 2013; Gary et al., 2011; Lavender et al., 2005; Xu et al., 2015). In the eastern North Atlantic, where ISOW is the primary deep water, two other ISOW pathways are identified (see Figure 1, dashed red curves): one crosses gaps in the Reykjanes Ridge (RR) north of the CGFZ (Xu et al., 2010; Chang et al., 2009), and the other flows southward along the eastern flank of the MAR into the Western European Basin (Xu et al., 2010; Lankhorst and Zenk, 2006). These two pathways are less well studied or observed.
Figure 1. A schematic plot of ISOW major spreading pathways. Abbreviated letters are: Iceland Faroe Ridge (IFR); Faroe-Shetland Channel (FSC); Faroe Bank Channel (FBC); Reykjanes Ridge (RR); Wyville-Thomson Ridge (WTR); Rockall Trough (RT); Rockall Plateau (RP); Porcupine Bank (PB); Bight Fracture Zone (BFZ); Charlie Gibbs Fracture Zone (CGFZ). Mooring locations are shown as black diamonds. CTD section is shown as a black dashed line.
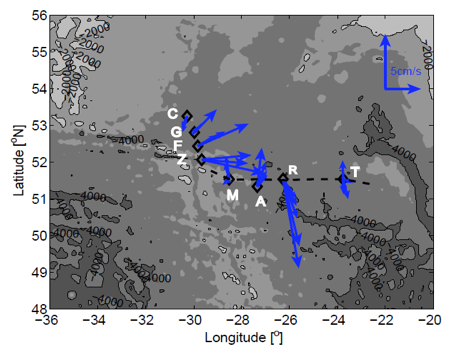
To study the southward spreading of the ISOW east of the MAR, I have been using previously unpublished current meter data east of the CGFZ from Dr. Walter Zenk at GEOMAR in Germany. The moorings C, G, F, Z, M, A, R and T (labeled in white in Figure 1), were deployed between 1998 and 1999 and stayed in water for 1 year.
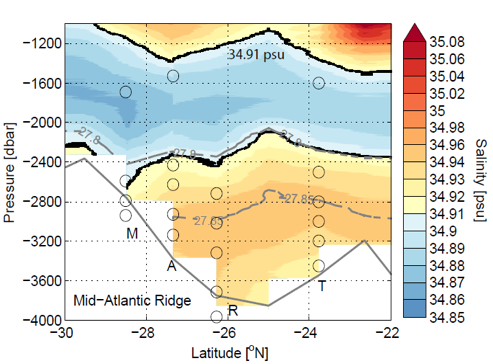
Figure 2 (left) shows the mean velocity at mooring locations at current meter depths between 1650 and 3890m. The deep-reaching northeastward North Atlantic Current is observed at moorings G, F and Z. A bottom-intensified southward flow is observed at mooring R, with a maximum southward velocity 8 cm/s measured by the bottom current meter at 3967 dbar. This strong southward spreading is in the salty ISOW layer, as shown in the hydrographic section from the CTD section (Figure 2, right) in June 1999, when moorings M, A, R and T were recovered. A similar southward spreading of deep waters in the ISOW layer is seen from the velocity fields in a high resolution model (1/12°) FLAME, with overall weaker magnitude and strong interannual variability (not shown).
A manuscript with these results is in preparation. In the manuscript, detailed analysis of this southward branch is conducted, including the spreading from a Lagrangian perspective, the origin of the south-flowing deep waters and a quantification of different branches of ISOW pathways in the eastern North Atlantic. In addition, the RAFOS floats released east of the RR at ISOW depths during the OSNAP cruise in the summer of 2014 will provide further evidence of the various spreading of ISOW.
This analysis work is completed with my advisor Susan Lozier, Walter Zenk, Bill Johns from University of Miami and Amy Bower from WHOI.
Figure 2. (Top) Mean velocities at the depths of all current meters for moorings C, G, F, Z, M, A, R and T (black diamonds). Moorings C, G, F and Z were deployed on June 25 1999 and recovered on July 1 2000. Moorings M, A, R and T were deployed on August 9 1998 and recovered on June 16 1999. All current meters are located between 1650 and 3890 dbar. The CTD section was shown as black dashed line. (Bottom) Observed salinity in June 1999 east of the MAR (~51.5°N) from the CTD stations shown in the left panel. The longitudes of the moorings M, A, R and T are shown as black circles. The Isopycnals are shown in dashed gray.