Author Archives: Sarah

A closed heat budget for the mid-latitude North Atlantic?!

by Nick Foukal

Now that the OSNAP and RAPID arrays are running concurrently, an obvious question arises: can we close a heat budget for the mid-latitude North Atlantic? A heat budget is a very simple concept – let us pretend that the ocean between RAPID and OSNAP is a box with an ocean flux coming into the southern boundary (at RAPID), another going out of the northern boundary (at OSNAP), and surface fluxes exiting through the top (Fig. 1). The sum of the oceanic fluxes and surface fluxes should equal the change in the temperature of the box, meaning the heat budget is “closed” (see equation below). This is a useful exercise because determining whether the ocean temperature variability is caused by ocean dynamics or surface fluxes gives us a better idea of how the system will evolve in the future. Though this task of closing heat budgets may seem incredibly simple to the lay audience, it has never been done before for a region as large and important as the mid-latitude North Atlantic.

Ocean temperature variability = surface heat flux + ocean heat transport divergence
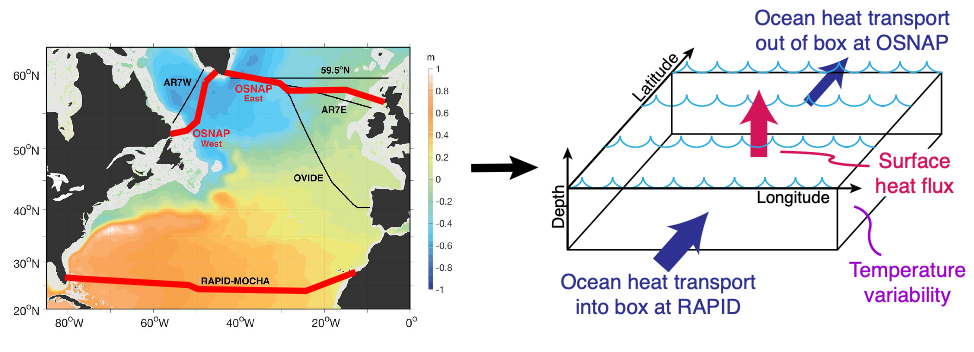
Figure 1 – (left) RAPID and OSNAP lines in the North Atlantic (red lines) and time-mean sea-surface height (colors). Figure adapted from Lozier et al. (2019). (right) Simplified box representation of the mid-latitude North Atlantic heat budget with ocean heat fluxes into the box at RAPID, out of the box at OSNAP, and a net surface heat flux out of the ocean.

To close the heat budget with observations, we need reliable measurements of all three terms. There are very reliable reconstructions of ocean temperature variability (from satellites and Argo floats), decent guesses of the surface fluxes (primarily derived from satellites on these scales), but very poor estimates of the ocean heat transports. The processes that govern ocean heat transport operate on such small scales that they are difficult to measure in the absence of dedicated in situ arrays. Consequently, what is often done in the literature is the ocean heat transport term is inferred from the difference between the other two terms, and the heat budget is assumed to close. But this is not completely satisfactory because the surface heat fluxes typically have significant uncertainties (more on that later), so relying on them as the “known” component in a heat budget doesn’t inspire confidence in the result.

This is where the OSNAP and RAPID lines come in – they offer an unprecedented opportunity to bound the ocean heat transports over a large region. Never before has a region of this size been this densely sampled. This means that we no longer have to rely on the surface fluxes and conservation laws to close the budget. By knowing all three terms of the heat budget, we can assess how closely we can close the budget… essentially how well do our measurements from independent platforms agree with one another?

There is still one hurdle to overcome in this problem, and that is the uncertainty in surface heat fluxes. This is not a new problem to the field, it has plagued both oceanographic and atmospheric studies for decades. There are two well-known unknowns in surface heat fluxes: (1) the time variability between different surface fluxes data sets do not agree with one another and (2) the global surface fluxes averaged over time do not integrate to what we would expect from observed ocean warming rates. I recently ran into the former concern in a recent paper (Foukal and Lozier, 2018) where we looked at the heat budget for the eastern North Atlantic subpolar gyre in two models, and the end result of our study depended on which surface flux data set we used. With respect to the latter concern, we know that from rates of global ocean warming, the global net surface heat flux must be around 0.5-1 W/m2, yet some surface heat flux products sum to almost 25 W/m2globally (Yu, 2019, Cronin et al., 2019). So there is good reason to doubt both the mean and the variability in surface fluxes, which is not encouraging.

As a taste of this uncertainty, I compiled time series of the surface fluxes over the region bounded by RAPID and OSNAP for three different surface flux products (Fig. 2). To give a rough idea of what we should expect from the surface fluxes, the oceanic heat flux into the box through RAPID from 2004-2007 was 1.33 +/- 0.40 PW (Johns et al., 2011), and the oceanic heat flux out of the box through OSNAP from 2014-2016 was 0.45 +/- 0.02 PW (Lozier et al., 2019). If we assume that these two time periods are representative of the long-term mean, and that the ocean is in steady-state (i.e. the temperature variability is zero when time-averaged), then we should expect the surface heat fluxes to equal the difference between the two oceanic heat fluxes, or 0.88 PW out of the box. Instead, the mean surface heat fluxes are 0.43 PW (ERA5), 0.11 PW (OAFlux), and 0.11 PW (NOCS), all directed out of the box. While it is encouraging that the sign of the fluxes is correct in all three products and that two of the products agree with one another, it also means that somewhere between 0.45-0.77 PW is missing in our heat budget. To put this another way, at least an entire OSNAP of heat transport is missing from this budget, and maybe more. Furthermore, the only statistically-significant correlation between the time series is a relatively weak (r=0.56) connection between the annually-averaged ERA5 and OAFlux. NOCS had no significant correlations to either of the other two. So overall, the spread between the three data products, their lack of coherent variability, and their disagreement in the mean with the net ocean heat divergence does not inspire confidence that we can close a heat budget for the mid-latitude North Atlantic.
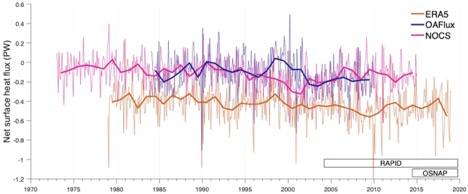
Figure 2. Surface heat flux variability integrated over the region between the RAPID and OSNAP arrays in three surface flux products (positive downward; units are petawatts = 1015 W). The thin lines are at monthly resolution, and the thick lines are annually-averaged. The seasonal cycles are removed from the monthly data to consider the non-seasonal variability. The ERA5 (Copernicus Climate Change Service) reanalysis is a ¼° product covering 1979-2018. The OAFlux (Yu et al., 2008) data set covers 1984-2009 at 1° resolution. The NOCS (Berry and Kent, 2011) surface heat fluxes are produced at 1° resolution for the period 1973-2014. The RAPID and OSNAP time periods are shown in the bottom right.

Before we lose hope, it is worth revisiting some of our methods and assumptions: (1) can we really compare the RAPID meridional heat transport from 2004 to 2007 to the more recent RAPID data from 2014 to 2016? Are the heat transports at RAPID from 2014 to 2016 perhaps lower than 1.33 PW? Lozier et al. (2019) report a net heat transport divergence of 0.80 PW between RAPID and OSNAP for the 2014 to 2016 period, which accounts for 0.08 PW of the missing heat fluxes. (2) Can we prioritize the ERA5 time series because it is the highest resolution and the most recently-released of the three products? During the 21 months of published OSNAP data, the mean ERA5 heat flux was 0.57 PW, or 33% larger than the 1979-2018 mean. So if we believe ERA5 over OAFlux and NOCS, then we are only missing 0.23 PW (0.80 PW – 0.57 PW), or only half of an OSNAP! (3) Maybe the ocean was not in steady-state for the OSNAP period (2014-2016), and instead of zero temperature change, the ocean actually warmed considerably? This is a bit of a stretch, as 0.23 PW would be a lot of warming. But it would be worth considering how much the region did warm over this time period to see how it affects the heat budget. After all, each of these heat transports has associated error bars, so maybe we can get close enough so that the error bars explain the residual? I will leave this analysis to further work, as this blog post is getting closer and closer to possible publication material…

So where does this exercise leave us? Surface heat fluxes are certainly a wild-card, but recent improvements (ERA5) seem to be trending in the right direction. In the next few years, OAFlux will be updated with higher resolution, so it would be worth checking if that time series validates the higher surface flux values of ERA5. Finally, I am contractually obligated to mention that continuation of the OSNAP line in the coming years is absolutely critical to closing the heat budget for the mid-latitude North Atlantic. A longer time series would improve our assumption of steady-state in the temperature variability and provide a better understanding of the inherent time scales of the overturning in the subpolar North Atlantic.


References:

Berry, D. I. and E. C. Kent (2011). Air-sea fluxes from ICOADS: the construction of a new gridded dataset with uncertainty estimates. International Journal of Climatology, 31, 987-1001.

Cronin, M. F. and 26 co-authors (2019). Air-Sea Fluxes With a Focus on Heat and Momentum, Frontiers in Marine Science, 6, 430, doi:10.3389/fmars.2019.00430.

Foukal, N. P. and M. S. Lozier (2018). Examining the origins of ocean heat content variability in the eastern North Atlantic subpolar gyre, Geophysical Research Letters, 45, 40, 11275-11283.

Johns, W. E., M. O. Baringer, L. M. Beal, S. A. Cunningham, T. Kanzow, H. L. Bryden, J. J. M. Hirschi, J. Martotzke, C. S. Meinen, B. Shaw, and R. Curry (2011). Continuous, Array-based estimates of Atlantic ocean heat transport at 26.5°N, Journal of Climate, 24, 2429-2449.

Lozier, M. S. and 37 co-authors (2019). A sea change in our view of overturning in the subpolar North Atlantic, Science, 363, 516-521.

Yu, L., X. Jin, and R. A. Weller (2008). Multidecade Global Flux Datasets from the Objectively Analyzed Air-se Fluxes (OAFlux) Project: Latent and sensible heat fluxes, ocean evaporation, and related surface meteorological variables. Woods Hole Oceanographic Institution, OAFlux Project Technical Report. OA-2008-01, 64pp. Woods Hole, Massachusetts.

Yu, L. (2019). Global Air-Sea Fluxes of Heat, Fresh water, and Momentum: Energy Budget Closure and Unanswered Questions, Annual Review of Marine Science, 11, 227-248.


OSNAP at Ocean Science Meeting 2020

Below is a list of Ocean Sciences 2020 special sessions that may be interested to the OSNAP community.  Abstracts are due September 11, 2019.


Ocean Sciences 2020 – OSNAP related abstract submission

We are want to draw your attention to the following session at the Ocean Sciences Meeting, 16-21 February 2020 in San Diego, CA. Abstracts can be submitted by visiting https://agu.confex.com/agu/osm20/prelim.cgi/Session/85893 until the submission deadline Wednesday, 11 September.

***

Atlantic Ocean Variability in A Changing Climate: Observations, Modeling, and Theories

Description

By redistributing a large amount of heat and salt, the Atlantic Ocean significantly impacts regional and global climate over a wide range of time scales. In particular, the Atlantic has seen strong variations in the ocean heat and freshwater content over the past couple of decades, as well as in the uptake and storage of anthropogenic carbon, which has been attributed to changes in the ocean circulation, e.g., those related to the Atlantic Meridional Overturning Circulation (AMOC). However, the mechanisms through which the ocean circulation changes (e.g., in the mean state and variability) and impacts the climate system (e.g., via a series of modes of variability such as the Atlantic Multidecadal Variability, the North Atlantic Oscillation), as well as the feedback, remain poorly understood. This session invites submissions that advance our understanding of the Atlantic Ocean variability, the role it plays in the atmosphere–ocean–sea-ice system, and its impact on the future climate. It aims to bring together recent progress in understanding the circulation and climate variability in the Atlantic sector from paleoclimate, historical and future perspectives. Studies utilizing observational, modeling and/or theoretical frameworks are all welcome.

******

We very much hope to see you in San Diego.


Best regards,

Feili Li (Duke University)

Rohit Ghosh (Max Planck Institute for Meteorology)

Laifang Li (Duke University)

Dian Putrasahan (Max Planck Institute for Meterology)


Postdoctoral Researcher – Georgia Tech

Postdoctoral Researcher in Physical Oceanography at Georgia Tech

A postdoctoral position in physical oceanography is available at the School of Earth and Atmospheric Sciences at Georgia Tech. The postdoctoral researcher will work on a recently funded NSF project, Leveraging the AMOC arrays and models to understand heat and freshwater transports in the North Atlantic. The main goal of this study is to place observations from the Atlantic Meridional Overturning Circulation (AMOC) observing system network into a basin-wide context in order to uncover the mechanisms governing heat and freshwater transports throughout the basin and into the Arctic. The study also aims to quantify, via observing system simulation experiments and optimal observing network design, the degree to which information contained in the AMOC arrays can constrain unobserved climate indices. 

The initial term of the appointment will be 12 months, with the possibility of extension for another two years based on performance.

Job Responsibility:  The individual will be expected to conduct independent, high-quality research in physical oceanography; publish papers; and present work at national and international conferences.  The postdoctoral researcher will also work collaboratively with oceanographers at Georgia Tech and at the University of Texas-Austin on projects related to this grant.  Opportunities for cruise participation as part of the Overturning in the Subpolar North Atlantic Program (www.o-snap.org) will be available.

Qualifications: A PhD in physical oceanography or a related field is required by the time of appointment. A background in large-scale oceanography is preferable and experience with observing system simulations experiments and large observational and model data sets is desirable.  Strong oral and written communication skills are expected.

Start date: On or about December 1, 2019.

Salary: Commensurate with the individual’s experience and education.

Application Procedure/To apply: Interested individuals should send a CV, a one-page statement of research interest, and the names and contact information of at least 3 references to susan.lozier@gatech.edu.  Review of applications will begin immediately and continue until the position is filled.

Research Scientist – Georgia Tech

Research Scientist in Physical Oceanography at Georgia Tech

A research scientist position in physical oceanography is available at the School of Earth and Atmospheric Sciences at Georgia Tech. The research scientist will work collaboratively on a number of projects focused on the Atlantic Meridional Overturning Circulation (AMOC).  Specifically, the research scientist will work closely with Dr. Susan Lozier, the international lead for the Overturning in the Subpolar North Atlantic Program (OSNAP; (www.o-snap.org), on the study of: mechanisms responsible for heat and freshwater fluxes in the North Atlantic; deep water pathways throughout the Atlantic basin; and the impact of subpolar dynamics on the downstream signature of the meridional overturning circulation.  Additionally, the research scientist will work closely with postdoctoral researchers and graduate students in Dr. Lozier’s lab and coordinate communication among the OSNAP international and national partners. 

Job Responsibility:  The individual will be expected to conduct high-quality research in physical oceanography; publish papers; and present work at national and international conferences.  The researcher will also work collaboratively with oceanographers at Georgia Tech and elsewhere on projects related to OSNAP.  Opportunities for cruise participation as part OSNAP will be available.

Qualifications: A PhD in physical oceanography or a related field is required, as is at least two years of post-PhD research experience. A background in large-scale oceanography is preferable and experience with observational and model data sets is desirable.  Excellent organizational and collaborative skills are required and strong oral and written communication skills are expected.

Start date: On or about December 1, 2019.

Salary: Commensurate with the individual’s experience and education.

Application Procedure/To apply: Interested individuals should send a CV, a one-page statement of research interest, and the names and contact information of at least 3 references to susan.lozier@gatech.edu.  Review of applications will begin immediately and continue until the position is filled.

Update on OSNAP Floats

by Amy bower

While the rest of the OSNAP team has been busy preparing the first continuous time series of the AMOC in the high-latitude North Atlantic from the OSNAP array measurements (link to Science paper), the Bower Lab has been steadily processing data from more than 120 deep-sea floats that were released in the deep currents of the AMOC between 2014 and 2017 as part of “OSNAP Floats”. These so-called RAFOS floats (RAFOS stands for RAnging and Fixing Of Sound) were tracked continuously underwater using an array of 13 moored sound beacons spread throughout the subpolar region. Once a day during each float’s mission, the float “listened” for signals from the sound beacons, and internally recorded the time it heard each one (usually only 2-4 beacons were in range on any given day). After two years of collecting these “times-of-arrival” from the sound beacons, each float dropped a ballast weight, popped to the surface and transmitted all its stored data via satellite. We have been reconstructing each float trajectory by converting the acoustic travel times to distances, and triangulating float position for every day. It is always an exciting moment when the complete trajectory pops onto the computer screen, usually revealing some incredibly interesting pattern of the flow deep in the ocean.  

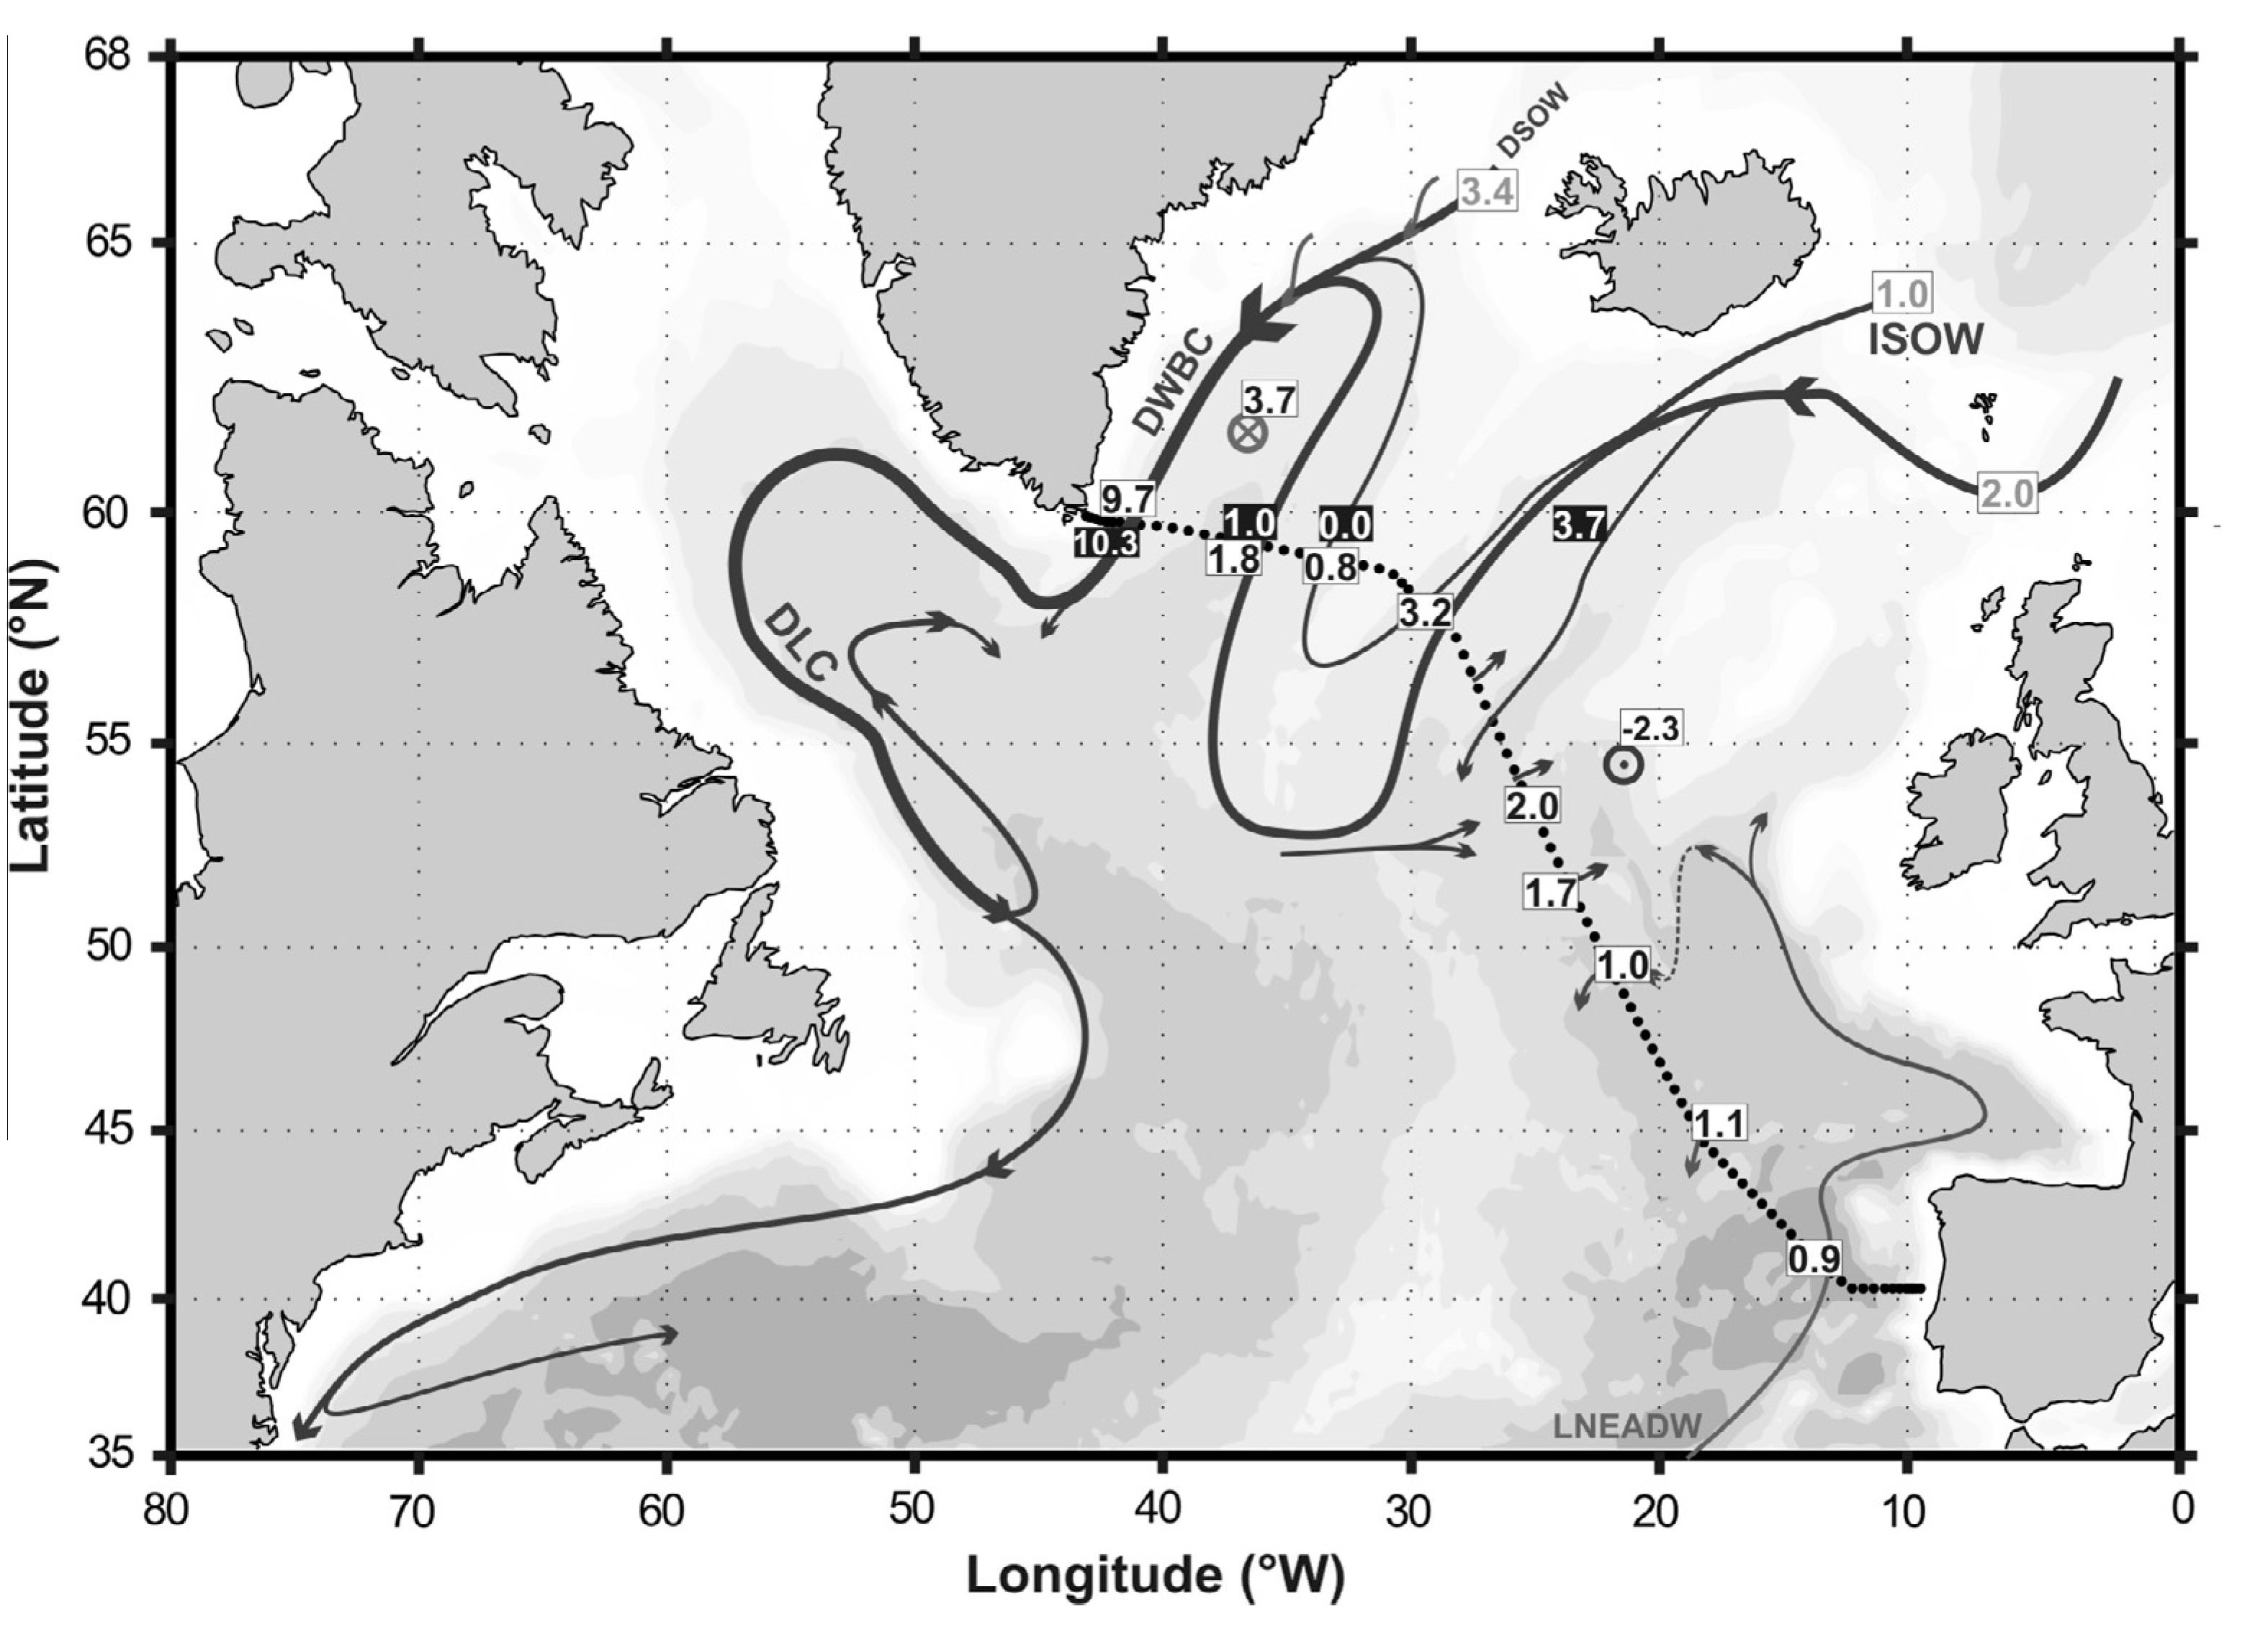
Nearly every diagram of the pathways of the lower limb of the AMOC in the subpolar North Atlantic show continuous lines of flow snaking around the rim of its three sub-basins:  the Labrador, Irminger and Iceland Basins (e.g., Fig. 1). This view of the deep circulation has been shaped largely by our observations of the subpolar ocean around its edges, which almost all show a relatively strong deep boundary current transporting modified versions of the dense overflows (Iceland-Scotland Overflow Water and Denmark Strait Overflow Water) that feed the lower limb of the AMOC. When we track the pathways of individual fluid parcels, or large groups of them, we see a somewhat different view of the pathways of the deep AMOC (Fig. 2). This “Lagrangian” view—by which we mean the ocean circulation as observed by following individual fluid parcels, in contrast to the “Eulerian” view, which is constructed from current measurements at fixed locations—highlights the turbulent nature of the currents in some regions of the deep ocean. The float trajectories show a much messier view because deep ocean currents are not always orderly streams of water flowing smoothly along, but rather consist of blobs or patches of water 10-100 km in diameter swirling around like slow-motion hurricanes.

In some regions, the Lagrangian and Eulerian views look similar, at least on the large scale. For example, most (but not all) of the floats released east of Greenland more or less follow the boundary around the southern tip of Greenland. In other regions, however, the boundary-following pipe-like view seems completely inadequate to describe the deep pathways of the AMOC. For example, floats coming through the Charlie-Gibbs Fracture Zone (a deep gap in the mid-Atlantic ridge that separates the Iceland and Irminger Basins) do not, in general, follow the boundary of the Irminger Basin. Instead, the floats spread westward and even southward in a somewhat chaotic fashion. Also, some floats released in the deep boundary current transporting Iceland-Scotland Overflow Water southward in the Iceland Basin never make it to the Irminger Basin through gaps in the ridge, but instead drift southward within the eastern North Atlantic, apparently having escaped from the deep boundary current system altogether.

So why do we care what pathways these deep waters take? For one practical reason—if we want to accurately monitor the strength of the deep AMOC, we better have a good idea where its major branches are so we can place our instruments judiciously. Also, the pathways of these deep water masses have an impact on how they are modified. A branch that carries deep waters along a slow, meandering interior pathway may lead to more stirring and modification of the water properties than would occur along a more direct, boundary-following path. This in turn affects how heat and other properties are re-distributed throughout the ocean.

The Bower Lab is looking forward to the upcoming General Assembly of the European Geosciences Union in Vienna, Austria next week, where we will have the opportunity to showcase the many and varied discoveries emerging from OSNAP Floats.

Fig 1. Recent diagram illustrating the circulation of the deep currents of the subpolar North Atlantic, From Daniault et al. (2016)

Fig. 2:  Trajectories of 123 RAFOS floats, tracked at depths from 1800 m to 2800 m between 2014 and 2018. Colors indicate individual float tracks.


Daniault, N. et al., 2016. The northern North Atlantic Ocean mean circulation in the early 21st century. Progress in Oceanography 146, 142-158

Modelling in the Labrador Sea

by Clark Pennelly

The Labrador Sea in the northwestern Atlantic Ocean is a bit like salad dressing: the multiple water layers present will not happily mingle with others nearby, just like oil and vinegar. Of course, this all changes when the salad bowl that is the Labrador Sea gets stirred up! Strong winter storms pass through the Labrador Sea, cooling the surface water and making it more dense. Should this cooling process continue, the density will increase until the surface layer will have the same density as the subsurface layer, allowing them to efficiently mix together – just like shaking a bottle of dressing. We call this ‘shaking’ deep convection.

However, the Labrador Sea is not simply a 2-ingredient salad dressing mixture. A fresh and cold water cap is at the surface; this water originates from the Arctic and could be from melting of Greenland glaciers, sea-ice from the Beaufort Sea, or even runoff from one of the many rivers which discharge into the Arctic Ocean from Canada, northern Europe, and Russia. A warm and salty layer of water from the Atlantic Ocean exists below this. Further below is yet another water mass which is cold and salty, a product of mixing the two layers above it during the cold winter; we call this layer Labrador Sea Water. There are even more layers beneath, but I won’t get into them for now. These top three layers are important to the deep convection and water mass formation that previous blog posts have discussed.

My PhD thesis revolves around the ocean layers within the Labrador Sea and how they are modified by a variety of sources, such as an input of freshwater, heat, or perhaps changes in the weather. As this region is notorious for its rough seas, particularly during the stormy winter, research cruises (see https://www.o-snap.org/fleur-de-sel-life/ ) tend to occur/gather data after the winter has passed when seas are calmer and the 12-point Beaufort sea state scale (see https://en.wikipedia.org/wiki/Beaufort_scale) goes from 10’s and 11’s down to more manageable single digits. Unfortunately, research cruises may therefore miss clues about the mixing and formation of water layers that happen during the convective season. I use computer models to investigate what may be occurring when research cruises are not around to gather data. While they are not without their own set of problems, models allow us a peek into the unknown from the comfort of a Beaufort 0 sea-state office.

One portion of my research explores rotating circular features, which we call eddies, that form off the west coast of Greenland. These eddies are produced via changes in the seafloor nearby. As the West Greenland Current moves alongside the west coast of Greenland, it carries both fresh and cold water at the surface as well as salty and warm water below. These eddies carry both water layers away from the coast and into the heart of the Labrador Sea. Both of these water masses impact the Labrador Sea in a different way, so these eddies are rather interesting and important features. However, these small events are notoriously difficult to represent within numerical models, especially multi-decade simulations. We had to get a little creative in order to make sure we would resolve these eddies as modelling such eddies requires a lot of computing resources. We set up a complex simulation which has a resolution of 1/60 of a degree, meaning this simulation should be able to resolve features where are larger than a few kilometers. The simulation requires over 600 CPUs and about 72 hours of real time to produce 40 days of simulation time. To put that into perspective, our regular simulations may use 60 CPUs and finish 2 years of simulation time in 72 real hours; quite the difference! We are interested in running this expensive simulation across 17 years, from 2002 to 2018, so we can capture variability across many years, though some quick math says that this simulation will take about a year to finish. But what do we gain by resolving the Labrador Sea at high resolution?

Well-defined eddies is what we get! You can see those individual eddies within the red circle. From running this model we’ve so far learned that those eddies can last up to two years, meaning that as they travel southwest from the coast of Greenland they may encounter multiple winters and therefore be involved in multiple rounds of deep convection. I’m currently exploring how these eddies evolve through their lifetime in the Labrador Sea. We know they bring substantial heating into the region, limiting deep-water formation. Thus being able to detect them with our model is crucial in order to achieve an accurate spatial representation of convection. Lower resolution simulations may fail to resolve these features and thus their importance. Since they persist for multiple convective years, they may have a more complicated story than previously thought which I hope my research will help uncover. Numerical modelling allows for the scrutiny of such events as observations within the Labrador Sea may not provide the full information we seek.

Arctic freshwater storage and export – what will it mean for the AMOC?

by Helen Johnson

with input from Sam Cornish and Yavor Kostov

The first results from the OSNAP array, published this month in Science (https://science.sciencemag.org/content/363/6426/516), are incredibly exciting! Over the 21 months of data collected so far, it has been the conversion of warm, salty, shallow Atlantic water into colder, fresher, deep water east of Greenland that has dominated the overturning circulation and its variability.  This challenges the prevailing view that deep water formation in the Labrador Sea to the west of Greenland is the major player in determining overturning variability.  And it gives us some clues about how changes further north, in the Arctic Ocean, might affect things.

A major motivation for measuring the overturning circulation with the OSNAP and other observational arrays arises from the expectation that the overturning will change as a result of human-induced climate change. The overturning circulation is predicted to weaken over the coming century, due to a warming and freshening of the high latitude North Atlantic. Part of the freshening expected in these critical deep water formation regions is due to changes in the amount of freshwater exported from the Arctic to the Atlantic, on both sides of Greenland. The Arctic Ocean has recently accumulated a large amount of freshwater, but we do not know if or when it will be exported to the Atlantic, or at what rate.

My group in Oxford have been investigating changes in the amount of freshwater stored in the Arctic, and the reasons for them, in the hope that this will teach us something about the changes we might expect in freshwater export (https://agupubs.onlinelibrary.wiley.com/doi/full/10.1029/2017GL076870). We have deduced the relationship between winds over the Arctic and total Arctic freshwater storage in a climate model. We now know that if the winds over the Arctic change, it takes the system at least a decade to come into a new equilibrium, with a different amount of freshwater stored.  Based on the relationship we deduce between winds and freshwater content, we estimate changes in Arctic freshwater content over the last century – and our time series agrees well with the limited observational data available (see figure), giving us confidence that the relationship is a useful description of the real world!

Our results suggest that the large increase in Arctic freshwater content since 1992 can largely be explained by historical changes in the winds driving the Arctic Ocean circulation (although we can’t rule out a smaller contribution from sea-ice melt).  What’s more, this increase doesn’t seem exceptional compared to variability in our time series over the rest of the century, suggesting that it may simply be natural variability.

Of course, changes in freshwater exported from the Arctic, natural or not, still have the potential to affect the overturning circulation! The long memory of atmospheric conditions revealed by our results is important because, provided we know what the winds have done, we can potentially predict changes in Arctic freshwater content a few years ahead. Based on our work so far, we expect Arctic freshwater content to decrease over the coming decade, and freshwater export to the Atlantic to increase.

The OSNAP array is ideally-placed to detect any impact of this change on the high-latitude overturning circulation. Based on the OSNAP results so far, we might expect that Arctic freshwater export through Fram Strait to the Nordic Seas (rather than through the Canadian Archipelago to the Labrador Sea) will have the most impact. So we have several hypotheses that our continued OSNAP observations and modelling efforts will put to the test in the coming years!

When science encounters art

by Femke de Jong

Collaborations in science are great, especially within a group as closely knit as OSNAP, but sometimes  the most surprising things come out of totally different kinds of collaborations. I saw beautiful examples of this in a special exhibit at the Boston Science Museum during my time as a postdoc at WHOI. Collaborations between scientists and artists led to new or different interpretations of the things we know. An example is the interpretation of the work of colleague Larry Pratt on turbulent torusses, the equations of which were somewhat intimidating in powerpoint presentations, but the art interpretation is beautiful and may even help us visualize those nasty equations.

photo from Larry Pratt’s website at http://www.whoi.edu/page.do?pid=142036

I recently got the opportunity to join a similar collaboration as this summer the island of Texel will host an art tour called S.E.A. or Science Encounters Art [link https://www.sea-texel.nl/]. In this project, artist are paired with scientists from the Royal Netherlands Institute for Sea Research, also based on Texel. The artful interpretations of the scientist’s research will be displayed outdoors on the island for three months (an added complication on a windy island). Around these sculptures, other forms of art like performance and poetry, will also be featured. Since I might actually be around for most of summer this year (no OSNAP cruise for us) this sounds like a really cool thing to experience.

The particular collaboration I’m involved in at S.E.A. is a little bit special because it does not involve one artist. I was matched with a group of students at the Gerrit Rietveld Academy of Art in Amsterdam. At the start of this project, during a visit of students to Texel, I was invited to give a presentation about my research. I explained about the ocean circulation, the OSNAP project and showed some videos of how we go about doing measurements at sea. This resulted in a ton of further questions, which I was happy to answer. Alter that week the students presented their first thoughts on possible projects. For the students this is a learning experience as well as an art project as this is their first commissioned project. Besides coming up with an inspiring idea they need to think about practical realization, budgets, logistics (does anyone think this almost starts to sounds like organizing fieldwork…?). 

A few weeks after the first introductions I was invited to the Rietveld Academy to come and listen to the presentations of the students plans. It was great to hear the very different interpretations and links they had made. Plans varied from man-sized wavy blue slides that represented current motions (and may feature some during rainy days) to an ironic video documentary on fake science. Currently the students are working out their plans in more details to see which ones can be realized. There will not be enough space and money to accommodate all the student projects, but the plan is to build as many as possible. Next to the students I’m also working with Alkmaar’s city poet, Joris Brussel. I invite everyone to come see and read (or hear) the results on Texel this summer.

A long road

by Susan Lozier

I have always been interested in advances in science that seemingly happen overnight.  I love the stories of someone walking through the woods when a new idea or solution to an old problem comes to mind, and then the next day he or she tests something in the lab, makes some calculations, or runs model simulations to check things out, and science is rewritten.  

Then there is the slow science of ocean observations, where almost nothing happens overnight.  Take OSNAP, for example.  Our first OSNAP time series will be published in the February 1st 2019 issue of Science, almost 12 years after OSNAP was first conceived.  There is nothing ‘overnight’ about this program.  Not even close.

In July of 2007, I was in Woods Hole, co-chairing the committee for the implementation of the US AMOC Program. At lunch one afternoon, sitting outside of a restaurant on Main Street in Falmouth, Bill Johns, Molly Baringer and I were discussing the success of the RAPID program and the new modeling results that were pointing to the disconnect between AMOC measures in the subpolar and subtropical regions.  At that lunch, the three of us agreed that we needed an AMOC measure of the overturning in the subpolar basin.  And so on that warm July afternoon the OSNAP seed was planted.  

Fast forward three years to April of 2010 when OSNAP was largely planned at a North Atlantic Subpolar Observational Program Workshop, which I hosted in Durham, North Carolina.  While I like to think that the workshop participants remember this workshop because of the beautiful weather, great conversations and exciting science plans, I am aware that many remember this workshop because of the volcanic eruptions in Iceland during our meeting.  Ash from Eyjafjallajökull thwarted many Europeans’ plans to travel back home, and they were stranded in North Carolina for a few extra days.  Considering how lovely spring weather is in North Carolina, it was not a bad deal.

After that planning meeting in 2010, one of the first items on the agenda at the 2nd meeting of the U.S. AMOC Science Team in Miami was to name our new program. We rejected a fair number of clunky nominations until we settled on OSNAP, a suggestion by my then 19-year old son, Joseph, who used this term quite frequently in conversations with his mother. 

At this point, I would be remiss if I did not call out the contribution and support from funding agencies and the program managers at those agencies.  OSNAP would have gone nowhere fast without that support. Dave Legler and Eric Itsweire were instrumental to making the Duke planning workshop, funded by the US AMOC Program, happen.  And Eric (program manager at the National Science Foundation) worked closely with Mike Webb at the UK National Environmental Research Council to coordinate the review of OSNAP proposals on both sides of the Atlantic.

OSNAP proposals went in in 2011, and then again in 2012 until funding came through in 2013 from the National Science Foundation for the U.S. contribution and from the National Environmental Research Council for the UK. The observing system was put in place in the summer of 2014, and the first data recovery finished the summer of 2016.  A long road indeed, but it can hardly be any other way with a program of this scope and size.  And, as with any long journey, it is great to have companions along the way.  OSNAP came together because funding agencies in the US, UK, Germany, Canada, Netherlands, France and China invested in this science and because oceanographers from these countries worked together on this common goal.  I have been extraordinarily fortunate to work with such extraordinary oceanographers.  The wait has been worth it.  If you get a chance to read our Science article, I hope you agree.

For now, OSNAP remains in the water, while we analyze more results, apply for more funding and enjoy the long game in ocean science.