Author Archives: Sarah

Which day is today?

By Camille Lique

If you ask anyone on the ship “which day is today?”, it will likely take a few seconds before you get an answer. It might actually even require a few try before you get the right answer. Time flies a bit differently at sea.

As we are working 7 day a week and we are doing very repetitive tasks, each day looks a lot like the previous and the following ones, and we quickly lose track of the day and date (the only reason I still know the date is because we need to fill a form with the date each time we start a new CTD station!). It’s been only 3 weeks since we left Brest. Yet, as most of the days are so similar, we have the feeling that we’ve been there for months! The fact that we hardly see any sign of a night (or just any darkness) does not help either. Have you seen the movie “Groundhog Day”? I’m pretty sure the director was on a scientific cruise when he thought of the story…

On the other hand, as most of us are working in shifts, we all end up trying to optimize the time we can sleep, stay in the canteen during the meals, or do something else before we run to start our shift. Moreover, no one wants to miss one of the fixed-time lunches or dinners. Hence, although I’m not carrying a watch, I can probably http://buyultramnow.com give you the time within a five-minute error (you can find large clocks in some strategic spots all around the ship).

Additionally, instead of the date, everyone on board can give you within a second how many days are left before 1) we start the travel back (and thus when we’ll stop working – next Sunday evening!) and 2) before we reach Brest and can go back home.

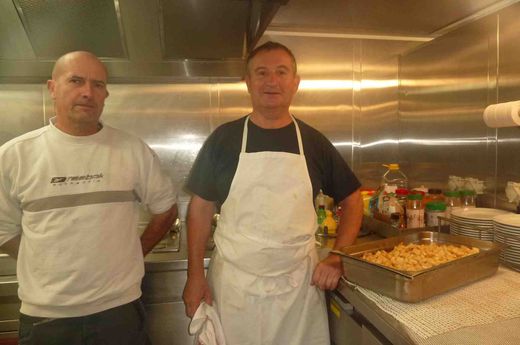
Well, all of that is true, but one day a week. On a Sunday, if you ask anyone on the ship “Which day is today?”, you’ll get the right answer within a second, and you will likely see a smile growing on the face of the person you’ve just asked. This is owed to two persons: our cooks (what would you expect on a French cruise?!). Sunday morning starts with pastries. And chocolates! They also dedicate special attention to Sunday lunch, which usually ends up with a special (and quite fabulous) cake (if not several!).
It does not take much to keep us happy!

Philippe and Jean-François

Philippe and Jean-François in the kitchen -Ifremer/RREX/C. Lagadec

Blue sky!

By Camille Lique

I don’t think we’ve seen any blue sky for a few weeks. And as we are at a latitude where there is hardly any darkness at night, it just left us with the feeling that we’re leaving in a constant grey-ish environment.

For a bunch of reasons, yesterday was a bit special.
First we were traveling for 24 hours from the end of our north CTD section to the beginning of the section following the Reykjanes Ridge. Hence, most of us had a day off from work and could skip our night shifts and enjoy a full night of sleep. Quiet priceless to not hear the alarm in the middle of the night or early in the morning!

Second, as we were going to our closest point to Iceland (~ 60 km to the Coast), we have enjoyed a full day of blue sky and could make sure that the sun is still there behind the heavy clouds (did not last long – as I am writing now, the winds (~45 knots) and waves (~6meters) are too strong for us to work and we are stopped, waiting for better weather). Although we were still too far to see the coast of Iceland, we have crossed a few fishing boats, giving us the feeling to be back to some kind of civilization.

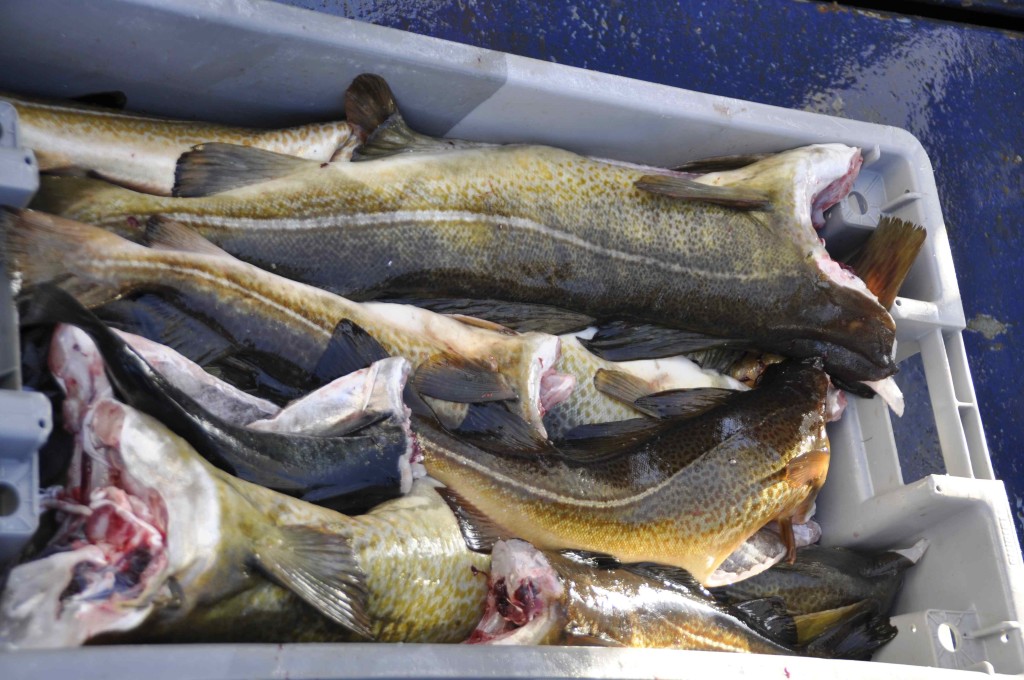
Last but not least, as we were reaching the shelfbreak and the continental shelf (where the depth gets to only ~100m), we made a short stop to fish. I must admit that I was quite skeptical at first, when we’ve seen the sailors preparing their super simple fishing lines. Yet, I was all wrong and the fishing session turned out to be quite lucky with more than a dozen big cods back on the boat. It should be enough for two meals for the ~45 people on board… Can’t wait for Sunday to taste it!

fish

Upcoming OSNAP events

There are a number of OSNAP events coming up over the course of the next few months. You can follow the cruise blogs here: http://www.o-snap.org/news-events/blog/. Please feel free to send any questions to sarah.clem@duke.edu.

  • June 5th – July 10th: RREX cruise aboard R/V Thassala across Reykjanes Ridge.
  • June 8th – July 7th OSNAP 8 cruise aboard the R/V Pelagia (Leg 1)  to service Iceland Basin and the Rockall Channel moorings and to deploy RAFOS buy prednisone online floats over the slopes east of the MAR ridge crest.
  • July 8th – July 29th OSNAP 9 cruise aboard the R/V Pelagia (Leg 9)
  • July 21st – A half-day OSNAP meeting (9:00 am-12:00 pm) will be held in Bristol, UK prior to the RAPID-US AMOC International Science Meeting.

Also, Canadian scientists aboard the CCGS Hudson finished their annual Labrador Sea survey recovering three OSNAP moorings and deploying new moorings along the Labrador slope at 53ºN.

Playing jigsaw with strategy

By Camille Lique

So. Here was the plan.
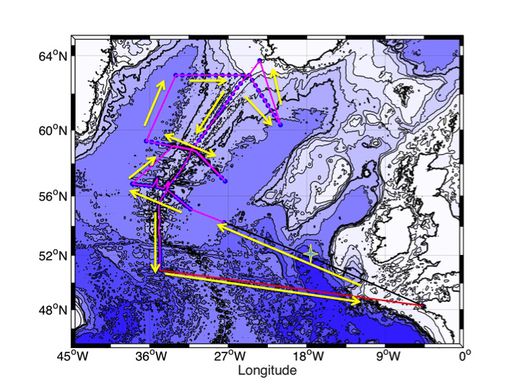
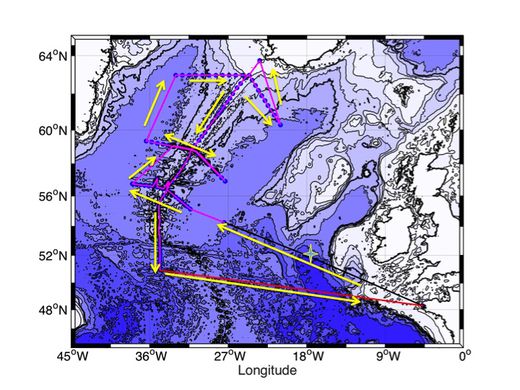
plan

Map of planned stations for the RREX cruise. -Ifremer/RREX/V. Thierry

Fairly simple on the paper. Leaving Brest on June 6th. Five days of travel to reach the South CTD section (each blue dots is one of the ~120 CTD stations). Then going to the middle section, do one path to deploy the moorings (we have 7 of them to deploy on the section) and then one path back for CTD operations, travel North to the third section, and end up with the section along the Reykjanes Ridge. Then 5 days of travel back to Brest, to arrive in the wee hours of July 10th. This looks simple but probably took days of thinking and work for our Chief Scientist, Virginie Thierry, back in her office at Ifremer. It was her work to choose the location of each station, compute the travel time from station to station, and try to optimize everything to make the best of our time at sea and come back with as much measurements as possible.

So, this was the initial plan. Yet, now, lets play it real. Once at sea, a few other things need to be considered:

  • We have not been so lucky with the weather so far. As we are sitting just along the storm track at the moment, we have been hit by several depressions (and their associated stronger winds and higher waves), some stronger then other. One might ask “what did you expect, going to this region?” but that’s a different problem. The ship is quite big and copes quite well with bad weather (although everything becomes increasingly challenging when the waves are higher, including simple things like eating, walking around the ship or sleeping…). Yet, moorings cannot be deployed when the wind and/or waves are too drastic. We can however carry on with CTD operations in almost any weather (up to some limit, which we were not far from reaching when we’ve had winds of 45 knots). All of that add strong constrains on what can be effectively done during a given day.
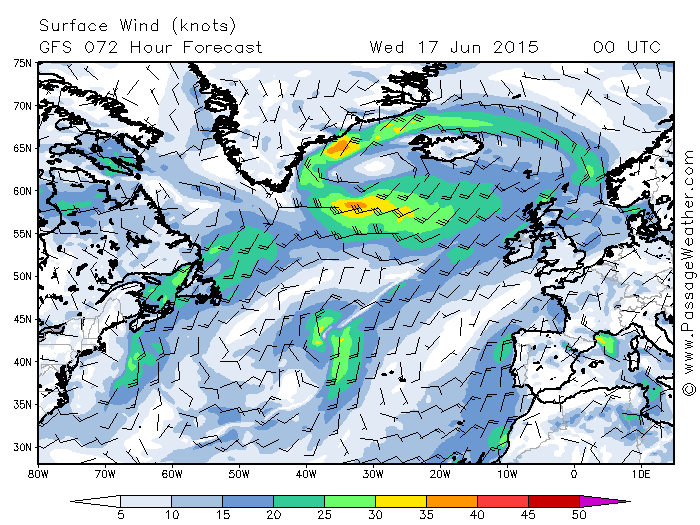
weather forcast

Weather forecast for June 17. The figure shows a example of one of the depression we have experienced so far, with winds higher than 30-35 knots.

  • Almost immediately after the CTD package comes out of the water at every station, the data are quickly pre-processed and examined. This is great help in spotting where interesting things happen (and hence where we should do more observations). Other parts of the sections can, on the other end, be done with less resolution (i.e. less stations) without too much loss of the information we want. Although very valuable, all of that again requires some adjustment to the original plan.
  • At sea, nothing takes same time twice. A given travel distance can be done faster or slower, depending on the weather, the direction of the winds and waves, and other random factors. Similarly it is sometime difficult to estimate the time that a given operation would take: for instance, recovering our VMP (microstructure profiler) can take between 5 minutes (when everything goes really well) and 30 minutes (when it becomes more challenging). This means again that all the initial calculations (made with a constant travel speed between two stations) need to be adjusted.
  • Add as a final constrain that we always need to move forward. No time for reflection, second thought, or to explore different options.

So, what did happen so far? Well, as expected, the plan has been adjusted… So far we have performed the south CTD section, made only one path along middle section, doing some CTD casts and deploying 3 moorings (leaving the remaining moorings for the way back, hoping to be more lucky with the weather at that time), and yesterday, we have headed north to the third section, traveling on the eastern side of the ridge instead of the western side as initially thought.

By now, we’ve all got used to see Virginie running around the ship, going from lab to lab, saying “I’ve just printed the new schedule!”. And everyone can see that, behind her constant smile and enthusiasm, some decisions have been a bit of a headache to make (while everything seems a bit of a relief when we have managed to stay on schedule for more than a few hours). And we all start our work shift by asking people from the previous shift how the plan has been adjusted. Yet, and most important, we have been constantly progressing so far and as much work as we could has been carried out. We’ll have to wait until the last days to see if the jigsaw is complete!

As a final note: I start to realize that being a Chief scientist on a scientist cruise is not that different from being the team manager of a football team. Everyone on the ship has an opinion on which strategy should be followed… Yet, everyone knows deep inside that we’re quite lucky that we don’t have to make any of the decisions.
RREX Cruise Observations

By Camille Lique

First, if you want to know where we are right now, have a look here.

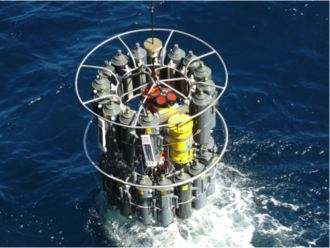
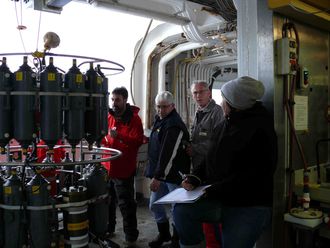
We are now running measurements at full speed. This means that we work in shifts and observations are carried out continuously, 24 hours a day. Part of the observations during the RREX campaign is done during CTD operations (around 120 stations are planned in total). This means that we stop every so often to lower the CTD package from the surface to the bottom of the sea, which carries a few sensors measuring the temperature, salinity, and dissolved oxygen content. Additionally, the CTD package carries bottles, which we close at different levels. Once the package is back at the surface, we sample water in the different bottles, allowing us to calibrate the sensors and to carry more measurements (pH, levels of nutrients). Last, the CTD package is used to measure the ocean current profile at each station, using the ADCP mounted on the CTD package.

The CTD package, Ifremer/Ovide

The CTD package, Ifremer/Ovide

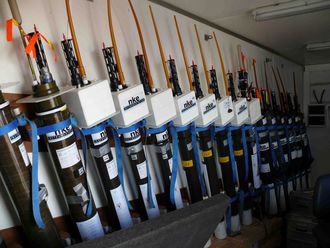
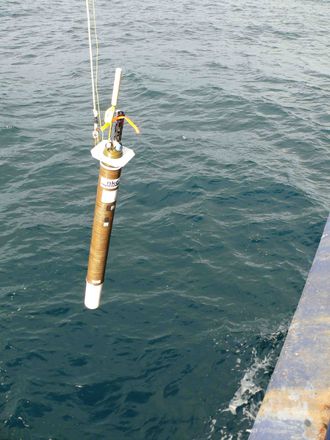
In addition to the CTD operations, we will deploy a bunch of Argo buy strattera online floats during the RREX cruise. An Argo float is an autonomous drifting profiler, which is programmed to drift freely around 1000m and every 10 days, change its buoyancy to dive to a depth of 2000m and then go to the surface, measuring a temperature and salinity profile. The float then transmits its data to a data center via a satellite and starts a new 10-days cycle.

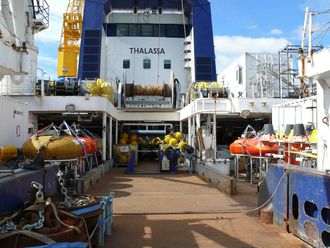
Argo floats on board of the Thalassa, ready to be deployed. -Ifremer/RREX/V. Thierry

Argo floats on board of the Thalassa, ready to be deployed. -Ifremer/RREX/V. Thierry

As of today, around 3000 Argo floats are drifting in the ocean (a float lasts around 4 years). Their data is used by the meteorology and oceanography forecast centers, as well as by researchers in order to quantify and study ocean warming and its possible consequences for sea-level rise.

A few days ago, deployed a special Argo float: A Deep-Arvor. This Argo float is indeed able to reach depths as deep as 4000m. It is only the fifth of this kind ever deployed, and the float has already transmitted its first observations!


RREX 2015 cruise underway

By Camille Lique

It has been almost a week since the RREX 2015 cruise started. After loading all our scientific equipment onto the N/O Thalassa, and finding a place for everything, we headed out from Brest (France) on Saturday, June 6th.

Ifremer/RREX/V. Thierry N/O Thalassa is ready for the departure

thalassa_depart

C. Maes Departure of the N/O Thalassa seen from Brest

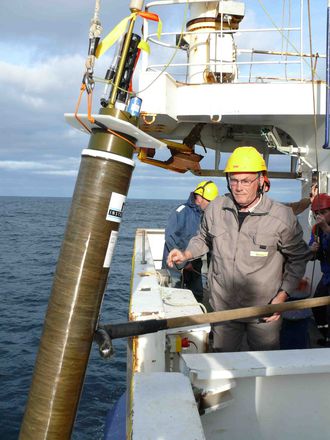
The first few days were fairly quiet. It takes almost five days to reach the Reykjanes ridge (South of Iceland) where we will do most of our measurements. It’s a http://buyantibioticsonline.org good thing as it gave us time to get use to being at sea again and get back on our feet. The journey has been busy with a first test CTD station to train everyone to the specific tasks they will perform, and to test all the instruments (and of course to fix some of them!).

RREX ctd

Ifremer/RREX/V. Thierry Sampling during the First test CTD station

By Wednesday night we had reached the first CTD station for the RREX cruise (blue dot on the map) and everyone was ready to start working during their night and day work shifts. More about the measurements next time!

Ifremer/RREX/V. Thierry N/O Thalassa is ready for the departure

Ifremer/RREX/V. Thierry Map of planned stations for the RREX cruise


Assistant Scientist – NOAA/AOML

NOAA/AOML’s Physical Oceanography Division has announced the opening of three new positions. These positions are at the ZP3/ZP4 level (equivalent to GS12-14 level, or assistant to associate scientist with tenure).

Duties of this position include, but are not limited to:

  • Developing and implementing studies and research to determine the effect of the ocean on the climate;
  • Designing, collecting, compiling, processing, analyzing and interpretating oceanographic data;
  • Preparing data reports and scientific articles; and,
  • Using knowledge of oceanographic sampling systems, applying this knowledge in problem solving and presenting results.

These positions can be found on USA jobs or by following the link below:

https://www.usajobs.gov/Search?Keyword=oceanography&Location=Miami%2C+Florida&search=Search&AutoCompleteSelected=true

These positions will remain open until June 15, 2015.

For more information about the division and a link to open positions can be found at:
http://www.aoml.noaa.gov/phod/

Understanding the variability of ocean transport and mixing measured by the OSNAP array

By Chris Wilson and Neill Mackay

osnap_array_schematic

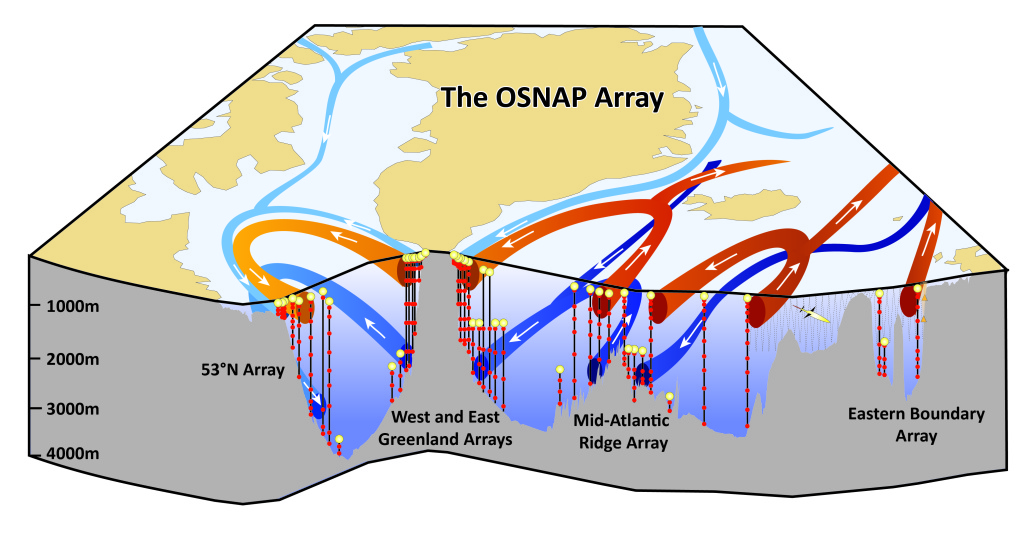
Figure 1: A schematic of the OSNAP array. (Credit: Penny Holliday).


The OSNAP array (Figure 1) will sample what is effectively a two-dimensional ‘slice’ of the ocean for several years at high spatial and temporal frequency. Of course, as shown in Figure 1, the ocean circulation is three-dimensional, and it varies in time. It contains a range of dynamical scales, from millimeters to millennia. As well as understanding the observations in the OSNAP array ‘slice’, our aim is to build a more complete picture of the circulation and to be able to make statistically robust statements about its variability in a changing climate. For example, is a change measured by the array over, say, a few months representative of a larger branch of the North Atlantic circulation, is it a response to external forcing or is it simply due to local intrinsic nonlinear variability?

Continue reading

Four decades of deep ocean measurements in the eastern subpolar North Atlantic

by Penny Holliday

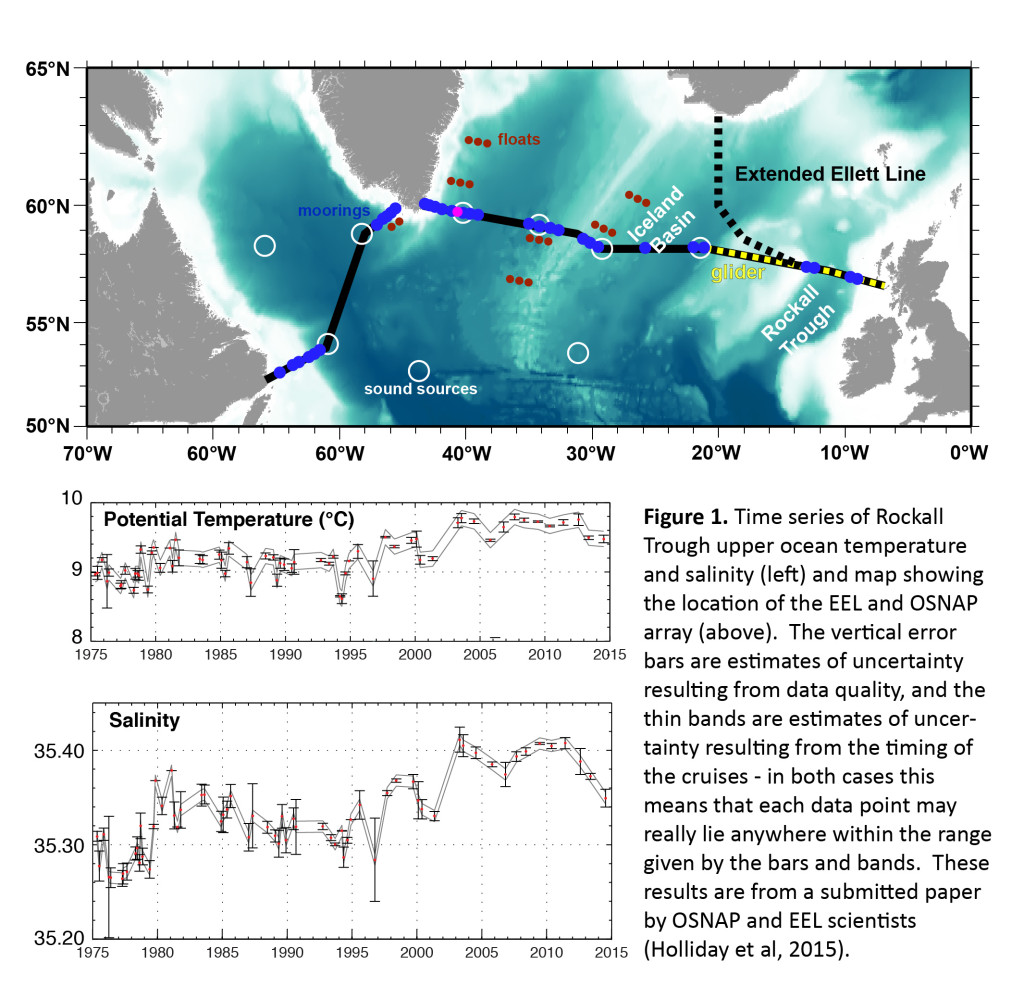
The OSNAP array is designed to meet our scientific objectives by making the most of existing measurements as well as collecting new observations. The eastern part of the array lies along part of a repeat hydrographic section called the “Extended Ellett Line”, or EEL for short. The EEL crosses the deep ocean between Iceland and Scotland, measuring the warm Atlantic water that flows from the subpolar region into the Nordic Seas and eventually the Arctic. The programme has been in place now for an amazing 40 years (1975-2015), making it a rare thing: a multi-decadal time series of high quality, deep ocean measurements. Holliday and Cunningham (2013) (http://www.tos.org/oceanography/archive/26-2_holliday.html) gives a full account of the history and achievements of the programme.

The EEL began in 1975 as a short hydrographic section across the Rockall Trough that was carried out several times a year, though rarely in the winter when the weather is hideous and waves are too big for research vessels to work (see Holliday et al 2006, http://onlinelibrary.wiley.com/doi/10.1029/2005GL025238/abstract to find out how alarming winter research cruises can be). Four decades of observations show that the top layer of the ocean (here around 0-800m) has warmed and there is a lot of shorter timescale variability (Figure 1). The salinity time series shows that there are also periods of highs and lows in salinity, each a few years in length. Look closely and you will see that the most recent years (since about 2010) have been slightly cooler and fresher than the mid 2000s, though values are still high compared to the first half of the time series. A new study of ocean heat content using Argo float data (Roemmich et al, 2015, http://www.nature.com/nclimate/journal/v5/n3/full/nclimate2513.html) confirms that the upper layer (0-2000m) of the northern buy viagra online subpolar North Atlantic has cooled since 2006 while the global ocean heat content has continued to rise. The reason for the patchiness of changes in ocean heat (and freshwater) content is ocean circulation, and OSNAP will bring us new understanding of the processes that underpin the changes we observe.

Figure1-01 Continue reading

The missing heat

by Nick Foukal

For the past 15 years, the slope of the global-mean surface air temperature (GMST) record has plateaued, a change that almost none of the IPCC global climate models (GCMs) predicted. More recently, a couple of papers have come out pointing to the North Atlantic (specifically the subpolar gyre) as the primary location for the missing heat of our climate system [Chen and Tung, 2014; Drijfhout et al., 2014]. The argument goes that because anthropogenic forcing (i.e. greenhouse gases) has increased over this period, yet GMST has not continued to increase, then the oceans must be storing the excess buy diflucan online heat. The North Atlantic is one of the few ‘deep water formation’ sites, thus it is a good candidate to absorb the heat. But let’s quickly review some background information and then the evidence for the North Atlantic.

Background

– Although almost none of the IPCC models predicted this slowdown in global warming, the SAT has never deviated outside of the ensemble range of the models, and 2014 (the warmest year on record) falls directly on the slope of warming from 1970-2000. Some climate scientists thus consider the hiatus as nothing more than noise about a warming trend, while others view it as proof that our GCMs are flawed. Continue reading