by Femke de Jong
Science has many aspects. The collection of data on the process of region you are studying; the actual digging through the data to find out what is going on (which is what most people seem to associate with science); writing down the results so they are documented and others can learn what you learned; discussing the results with colleagues in your fields and hearing about new methods and results; and the training of new scientists. Sometime all of these happen within a very short time frame.
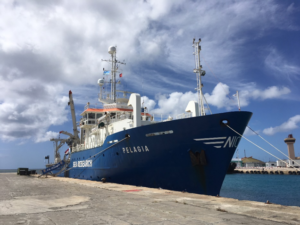
After finishing a proposal and a paper draft at the end of January, February started with a short research cruise. This may not have been an OSNAP cruise, but all hydrographic cruises share very similar aspects. The run-up to the cruise is a lot about getting the logistics arranged and preparing a cruise plan. Does everyone have
the right paperwork to go on board? How are we going to divide the tasks on board? How many measurements stations will be able to do and where? And most importantly… will all the instruments work and the data be good? Once on board things start to fall into place. Those who are back in their familiar environment show the ropes to the newcomers. Instruments are prepared and plans discussed with the ship’s crew. During the cruise, while data collection progresses, we process the initial results and get an idea of whether our science goals will be fulfilled. Once land is in sight on the other end of the cruise everyone is tired and ready to go home.
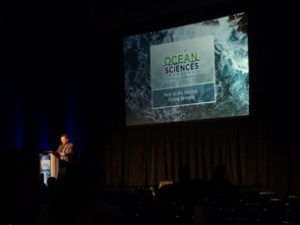
Unless, due to some haphazard planning, you need to proceed directly to a scientific conference. While cruise departure and arrival day are never fixed until you actually departed or arrived, dates of meetings with several thousand participants tend to be quite fixed. The Ocean Sciences Meeting is a biannual meeting with all fields of oceanography. About 5000 people met in Portland, OR, this week to discuss their work. This happens in “sessions”, submeetings organized by topic, of which there were nearly 500. The new OSNAP results were presented in
the AMOC (Atlantic Meridional Overturning Circulation) session. Several of us had oral talks. Susan Lozier presented the (near) final numbers of the overturning over the whole OSNAP line. Penny Holliday shows us the circulation estimates from the OSNAP hydrographic sections in 2014 and 2016. Bill Johns detailed the Iceland Scotland Overflow Water flow along the east flank of the Reykjanes Ridge. I presented our investigation of variability west of the Reykjanes Ridge. Feili Li compared Labrador Sea Water formation with Labrador Sea overturning. More OSNAP talks were held in other sessions (see OSM blog post). Since there are too many of us to all get talks (even if they only last 15 min) some are requested to present posters. Poster sessions are held during the last two hours of the day. Presenters stand next to their posters and the rest of use walk around and either browse poster titles to find something that interests us or seek out poster titles we identified beforehand in the program. Often the most interesting discussions are held at posters we unintendedly come across and these are great chances to meet new people. Between the talks and posters we catch up with old friends or meeting with co-authors on papers or potential new collaborators.
Now that I’ve returned from the Ocean Sciences Meeting I’m starting a new chapter. My first PhD student, Roos Bol, has started her position at NIOZ this week. She recently finished her MSc thesis at the NOC in Southampton and I’m very excited to be working with her. She’ll be investigating our OSNAP data from the Irminger Current array and will be coming along on this summer’s OSNAP cruise. Over the next four year I’ll expect to be teaching her all about data collection, data processing, writing down results and giving presentations at conferences.

