by Marilena Oltmanns
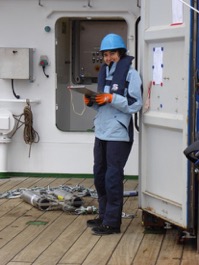
The temperature time series from 4000 m depth in the central Labrador Sea spans two years and is characterized by small and big waves and swirls. It is full of mysteries. As a postdoc from GEOMAR it‘s my second research expedition from St. John‘s to Reykjavik and my task on board is to assess the quality of the data to decide if the instruments can be re-deployed. This means that I am one of the first to look at the data after we recover the instruments from the water – in this case from 4000 m depth. Considering that we can hardly enter this region ourselves, we send measuring instruments there every two years to have them record what we cannot see.
Already a first glance at the data reveals that it‘s not as calm down there as one may think. Numerous oscillations in pressure, temperature and salinity reflect a colorful chaos of many different signals and only through careful analyses we may have the chance to decipher the causes underlying this rich variability. Where does the water originate from? When and where has it been at the surface? Which known or yet undetermined processes have changed it? And which time scales of variability are dominant? This deep, there is no clearly distinguishable seasonal cycle because the distance to the surface is too large. Instead, other mechanisms have left their imprint on the water near the sea floor, most of which cannot be identified by this initial glance. In fact, they may remain elusive even after rigorous analyses.
At any rate, this first look at the data tells me that the instrument has gone through an  exciting two years – and that an engaging analysis is waiting for us. Bearing in mind that measurements can drift and have offsets, I always remember that no instrument is perfect and that it only shows us one small fraction of what is happening 4000 m below sea level. Much remains a mystery.
