The blog of the cruise can be found here (German & English): https://www.oceanblogs.org/msm129
Chief Scientist: Johannes Karstensen
Co-chief scientist: Fehmi Dilmahamod
The journey begins
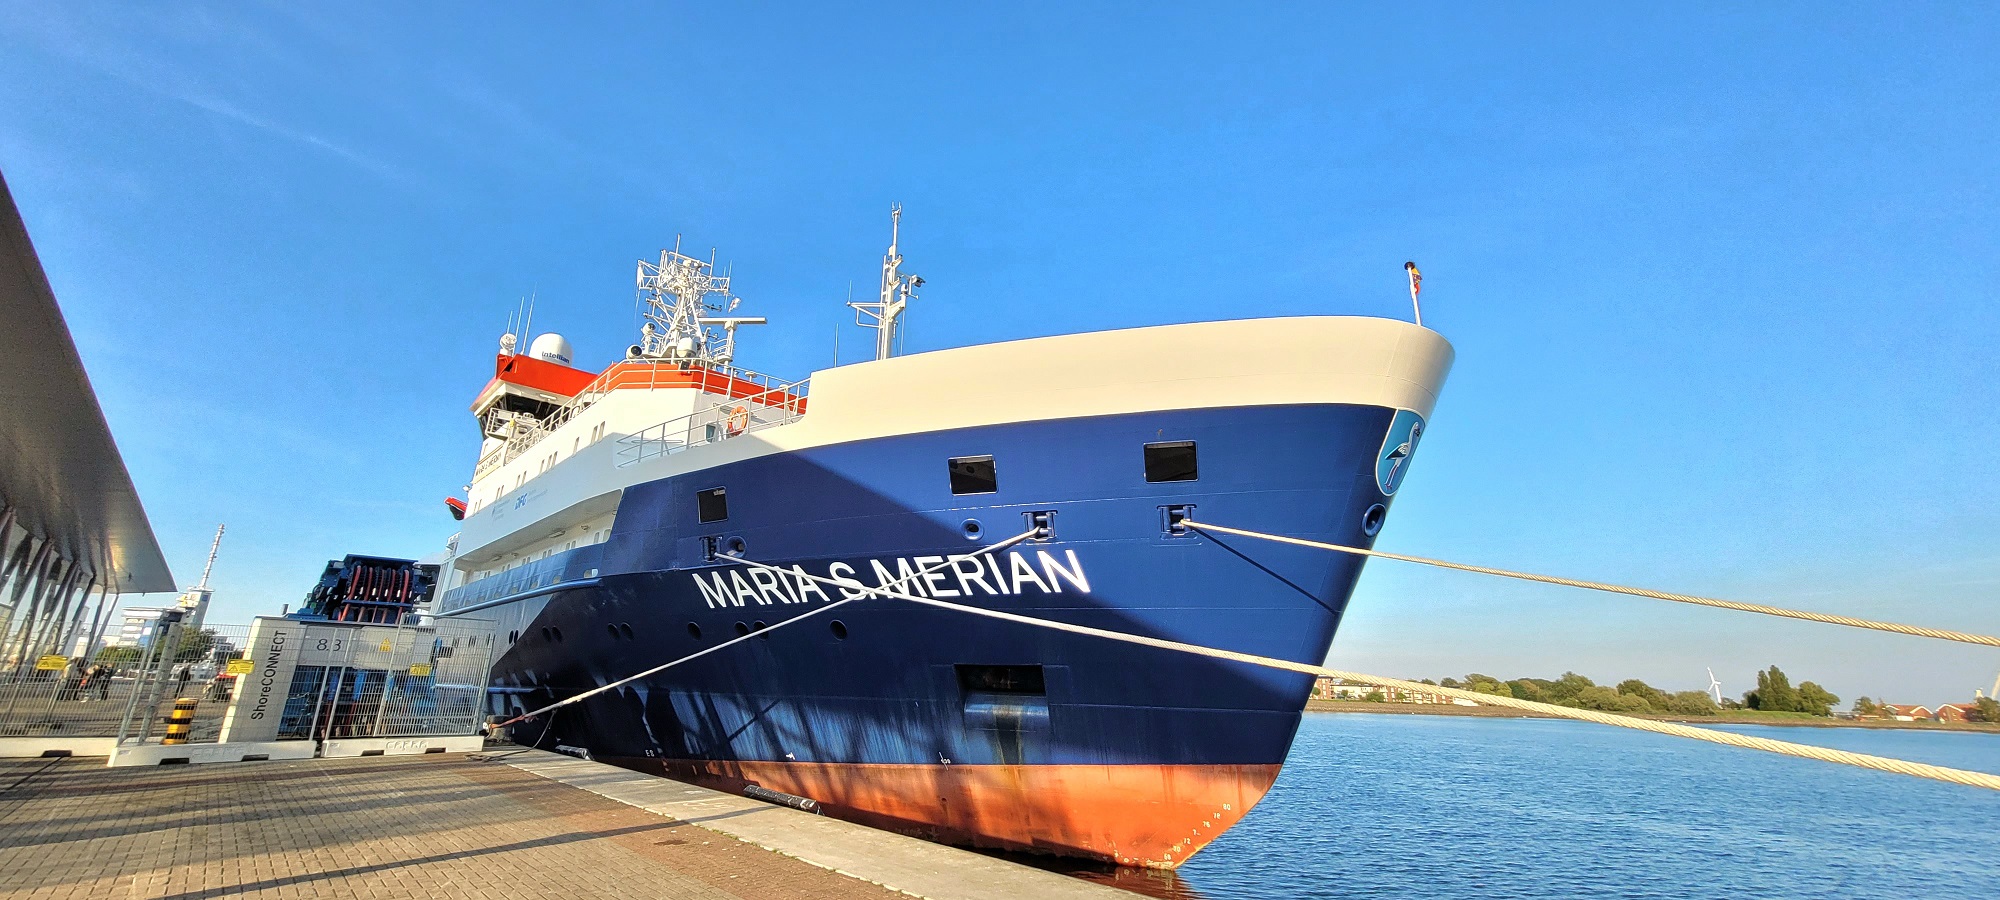
Maria S. Merian in the harbour of Warnemünde (Photo: Abed Hassoun)
It’s time for the Maria S. Merian to embark on the research mission MSM129. In the first part of this mission, the ship will cross the Atlantic—starting in Warnemünde and reaching St. John’s in Canada around 10 days later. In the second part, it will travel from St. John’s through the Labrador Sea to the tip of Greenland and then on to Reykjavik. This blog will accompany the research ship and its inhabitants throughout the journey, providing you with insights into the research and life on board.
So let’s start with the first part of the journey and the question of what the goal of this research trip is.
On every research trip, the respective research groups bring their own measuring devices that they need for their projects. At the same time, there are also devices permanently installed on the ship. Fixed sensors collect information about surface water temperature, salinity, and chlorophyll, as well as current speed. The German Marine Research Alliance (DAM) has made it its mission to preserve and make these underway data (so-called because they are measured while underway) long-term and sustainably usable for science and society. This includes, among other things, quality control and the provision of the data in near real-time.
This expedition focuses on these underway data and has become the main reason for the research trip. The special aspect of this is that data management staff, who normally work from land, will join the scientists on site. The goal of the trip is to optimize the processing and provision of the underway data. Several institutes are involved in this task: MARUM in Bremen, Alfred Wegener Institute in Bremerhaven, the Institute for Baltic Sea Research in Warnemünde, the Institute for Chemistry and Biology of the Marine Environment in Wilhelmshaven and the University of Oldenburg, as well as the GEOMAR Helmholtz Center in Kiel.
We left the port of Warnemünde on May 25th in the best weather. By now, we are already a bit further away from the coast and have experienced the first thunderstorms. Not all measuring devices are switched on yet—some cannot be used all the time and everywhere because, even on the water, national borders must be respected. On our way through the Kattegat, Skagerrak, and along the east coast of Great Britain, we cross several national waters. Only in international waters are we allowed to turn on all the measuring devices permanently.
The FerryBox
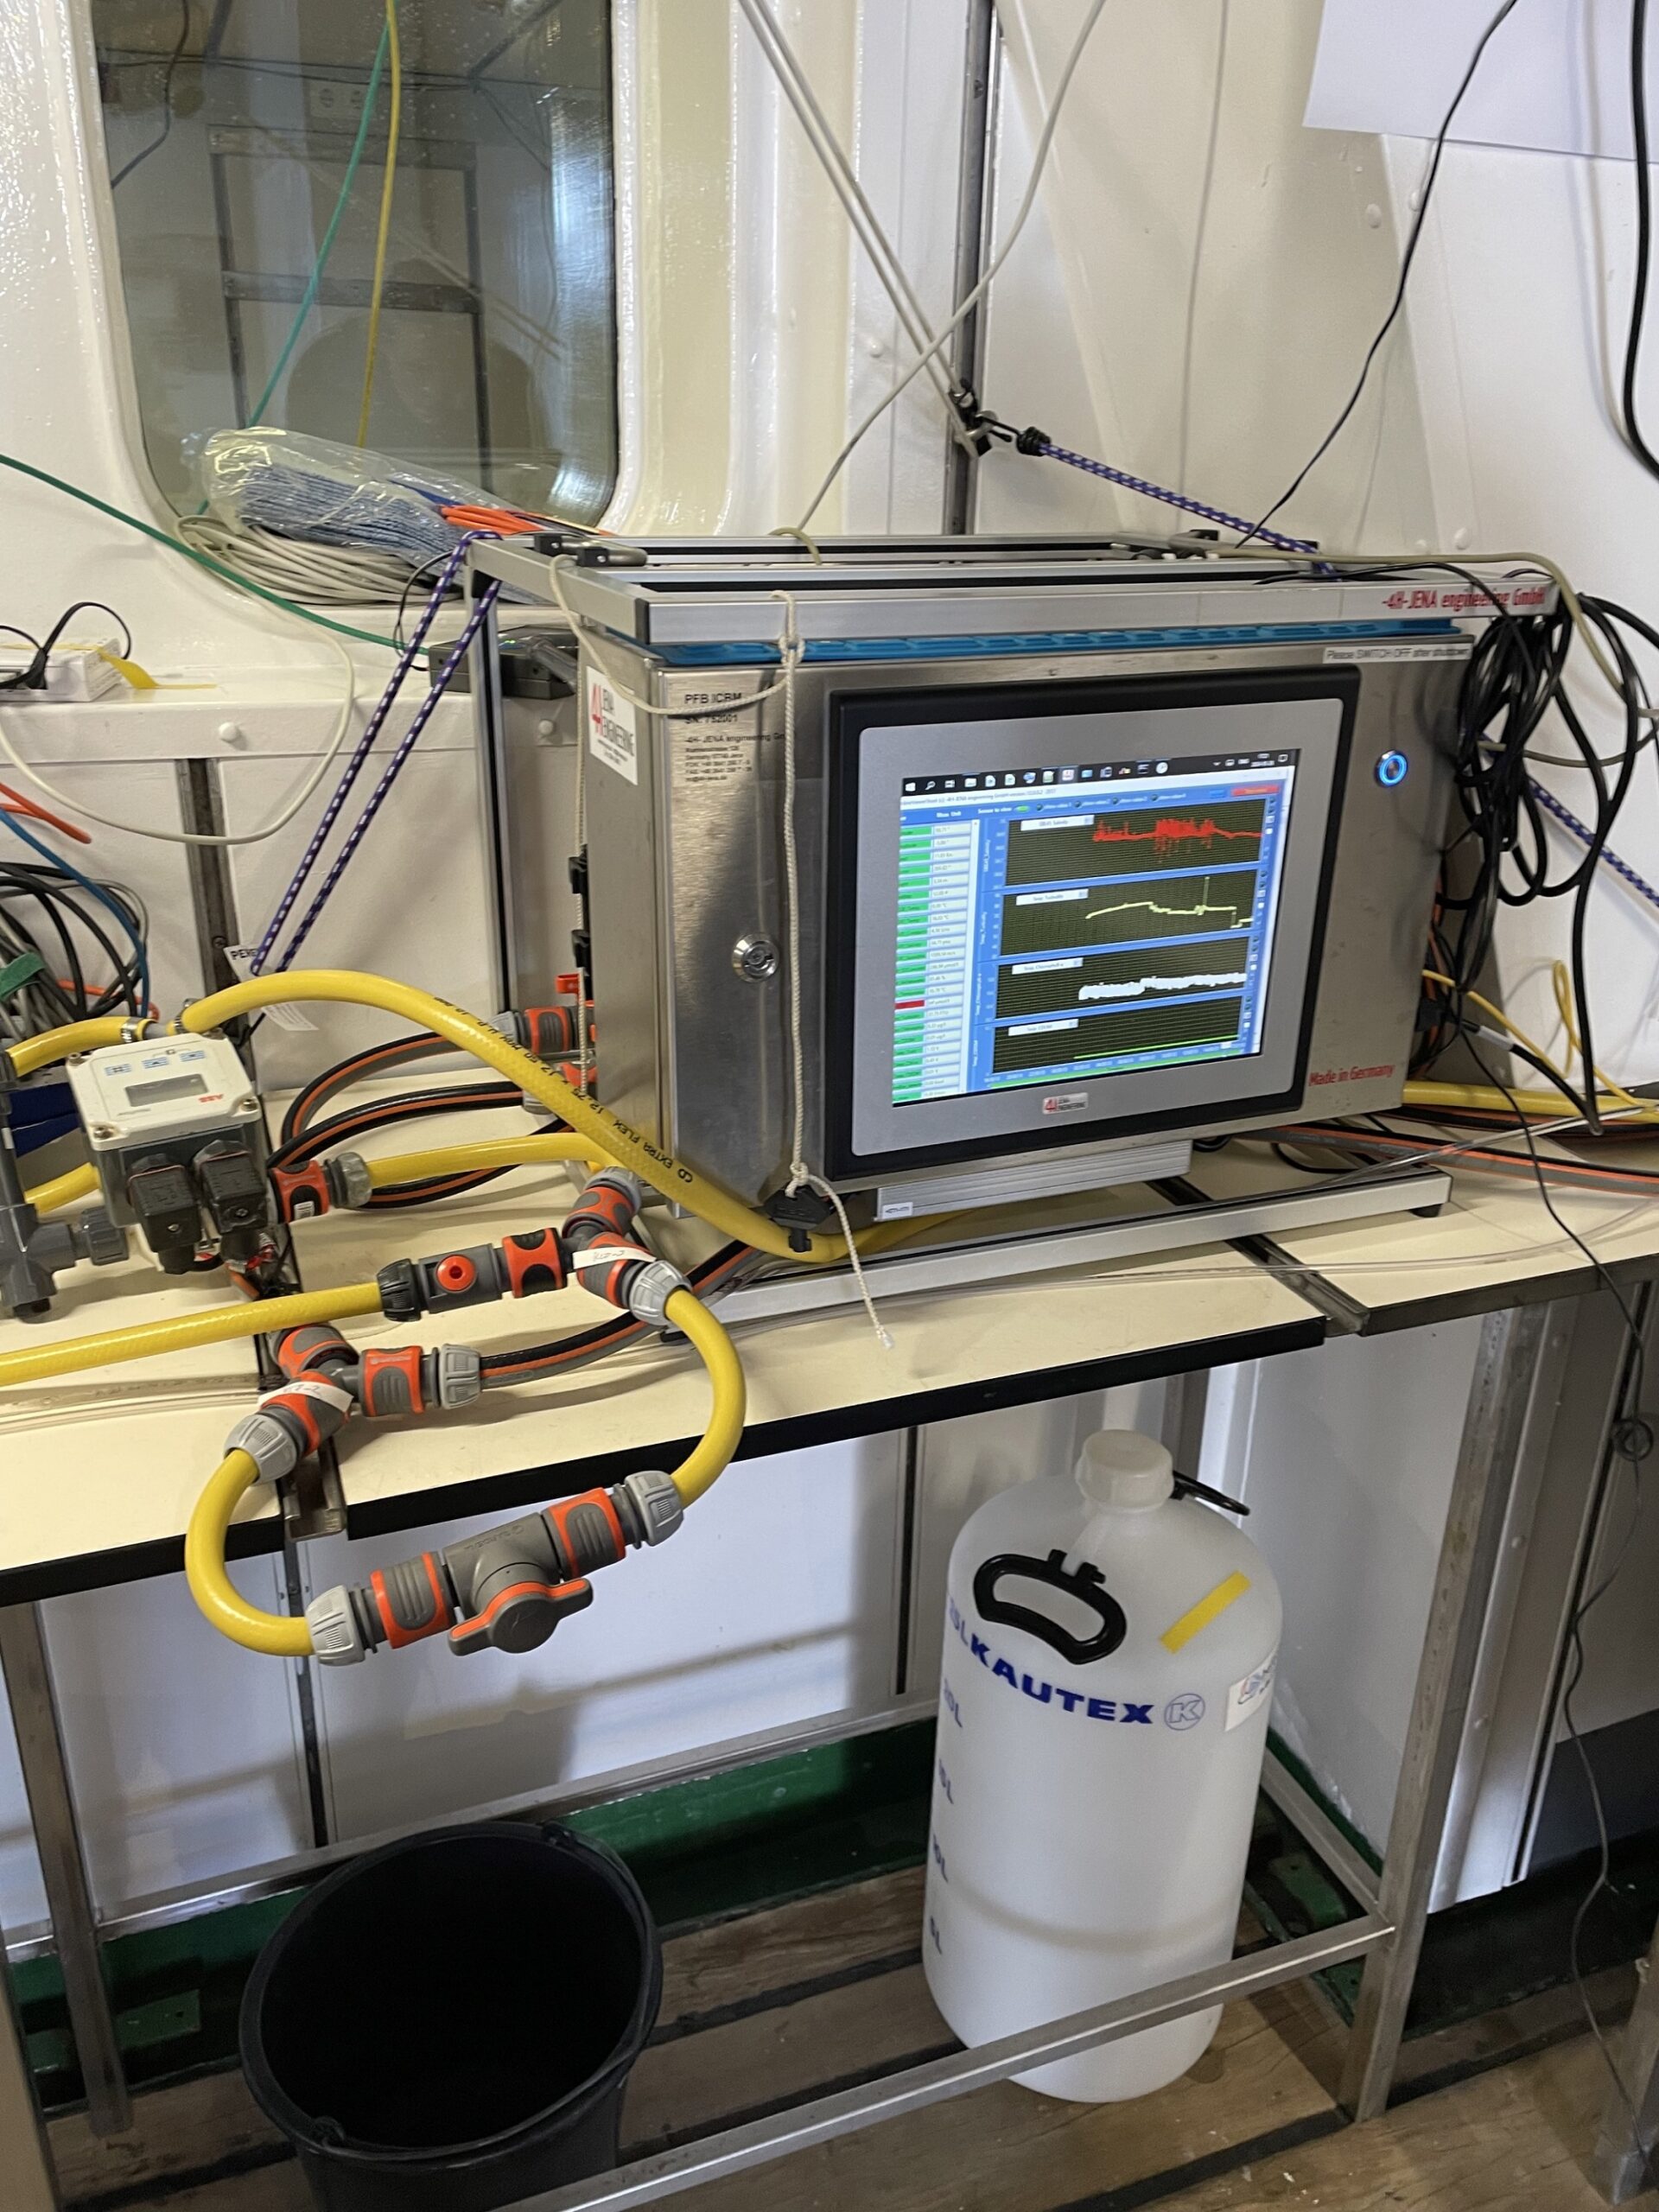
FerryBox (Photo: Christiane Lösel)
Today we accompany Julia from the Institute of Marine Chemistry and Biology of the University of Oldenburg in her work on the Maria S. Merian. The last post was a bit about the underway data, which are measured on ships. Julia brought with her another device that also falls into this category: a FerryBox.
The FerryBox is a so-called flow device. This means that water under the ship is sucked in with a pump and passed through the device. The instrument can then measure the temperature and salinity of the water. These two quantities are important because they determine the density of the water and thus provide information about currents. In addition, the device also measures bio-optical values, namely chlorophyll A and CDOM (Colored Dissolved Organic Matter). Chlorophyll provides information about how much phytoplankton is present in the water. Phytoplankton are small algae that form the basis of the entire marine food web. The great advantage of the Ferry Box is its modular structure. For example, sensors for total alkalinity (how much acid the water can bind), carbon dioxide or PH value can also be added.
So these are all important variables for understanding processes in the ocean. But why is the device on board and where does the name FerryBox come from?
Maybe we’ll start with the declaration of names. The FerryBox is meant to be used on ferries. Ferries are good for carrying measuring instruments, as they regularly travel the same distance. The FerryBox is a box-shaped device that can measure autonomously and only needs to be maintained by a scientist from time to time.
The main objective of this first part of the research trip is to optimize the transmission of data from measuring instruments to land. The FerryBox can be seen as an example of this. Julia brought them aboard and, together with Norbert from the Alfred Wegener Institute, is now making sure that the data is transmitted to shore in near real-time. When she is back ashore in her office during the second part of the research trip, she can retrieve the data from her computer. If an error should occur, she can notify the ship directly so that the problem can be rectified immediately. Julia also calibrates the FerryBox. To do this, she passes water samples through a filter in the lab and then stores them in a refrigerator with a temperature of -80°C. This means that the samples remain stable until they are subsequently evaluated in a laboratory in Germany.
In the end, the developed software should be usable as a blueprint for other devices. The near real-time data is then also publicly visible and can be used by anyone.
Seamounts
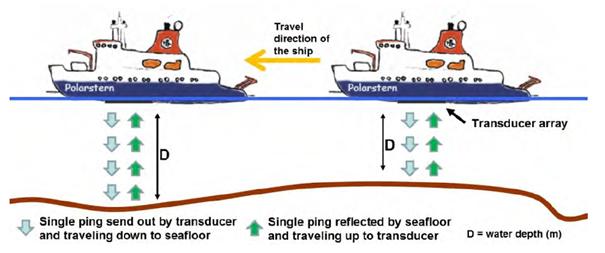
Scheme explaining the echo sounder (Damaske, 2013)
If you go on a hike in the mountains, you usually look at a map as the first step. It is also important to have a map of the ocean. Not only a map listing the coasts and islands, but above all a detailed map of the topography of the seabed. During the middle of the 19th century to the beginning of the 20th century, depth measurement was still carried out with a weight at the end of a long rope, but today the echo sounder patented by Dr. Alexander Behm from Kiel in 1913 is used in most cases.
The most accurate and scientifically recognized bathymetric data collection is produced by GEBCO (General Bathymetric Chart of the Oceans). The dataset is based on collected data from vessel depth measurements and was first presented to the public 120 years ago. Today, this data set consists largely of so-called predicated bathymetry. This means that satellite measurements are made, which can then be verified and supplemented with bathymetry measured by ships. The satellites can derive from the measured sea level via various physical relationships whether a seamount is underwater. This method allows us to map the entire ocean, but it is very inaccurate. Seamounts less than 2 km in size, for example, cannot be measured. The GEBCO dataset is now renewed every year. The only drawback is that it lacks detailed metadata. Metadata is background information indicating, for example, by which institute or on which vessel the data provided were measured.
Since the data set is largely based on ship measurements, it is highly dependent on ship routes, some of which have very large gaps. Only about 20% of the seabed has been measured in this way (Mayer et. al 2018). On this journey, we want to map some of these gaps. More specifically, we want to map so-called seamounts.
Seamounts are submerged mountains of volcanic origin. They are typically conical, often with craters, linear ridges or shallow peaks. The shape often depends on the origin of the seamount. They are formed in places where tectonic activity occurs, such as near oceanic ridges, arch islands, or at places where hot material rises from the Earth’s mantle beneath the tectonic plate. Seamounts that form near plate boundaries, i. e. where the lithosphere (the Earth’s crust and the outer part of the Earth’s mantle) is still fresh and thin, tend to be rather small. Small in this case means less than 2. 5 km altitude. Larger seamounts with a height of 3-10 km often form in places where the lithosphere is older and thicker. Although it is not known exactly how many seamounts there are, one thing is certain: there are many!
Due to their volcanic origin, seamounts are very interesting from a geological point of view, as they can provide insight into the composition and temperature of the Earth’s mantle. Seamounts are also important for oceanographic observations, as bathymetry influences currents and mixing processes. Seamounts can act as barriers that prevent cold deep water from mixing with warm surface water. Finally, they are also the centre of a diverse ecosystem. This is because nutrient-rich deep water rises at their flanks (a process called upwelling) and thus forms the perfect basis for fish and diverse flora and fauna.
So now we know why we should be interested in seamounts, that there are many of them out there, and that a lot of them have not yet been mapped.
On our planned itinerary we pass some places where seamounts are suspected. By only slight course changes it is possible to drive over some of these seamounts and to measure them with the ship echo sounder. An acoustic signal is sent to the seabed, which is reflected on the ground and then received when returning to the ship. Thus, the measured time between sending and receiving can be used to measure the distance between the ship and the seabed. This principle is also used here on the Maria S. Merian, with the difference that not only one signal, but a whole range of signals is emitted. This allows a strip with a width of six times as large as the water depth to be measured. In our current measuring area the water depth is 2500-3000 m which corresponds to a mapped strip of 15 to 18 km wide.
We are at the moment near the Mid-Oceanic Ridge, a place where new lithosphere is forming. As we have already learned, the seamounts to be found here will tend to be smaller. In this area, the number and density of predicted seamounts is also significantly higher. Our first mapped small seamount, still far from the Mid-Oceanic Ridge, showed a shallow peak with an approximate height of 450 m. With 7. 5 km wide and 8 km long, it was almost round and extremely worth seeing.
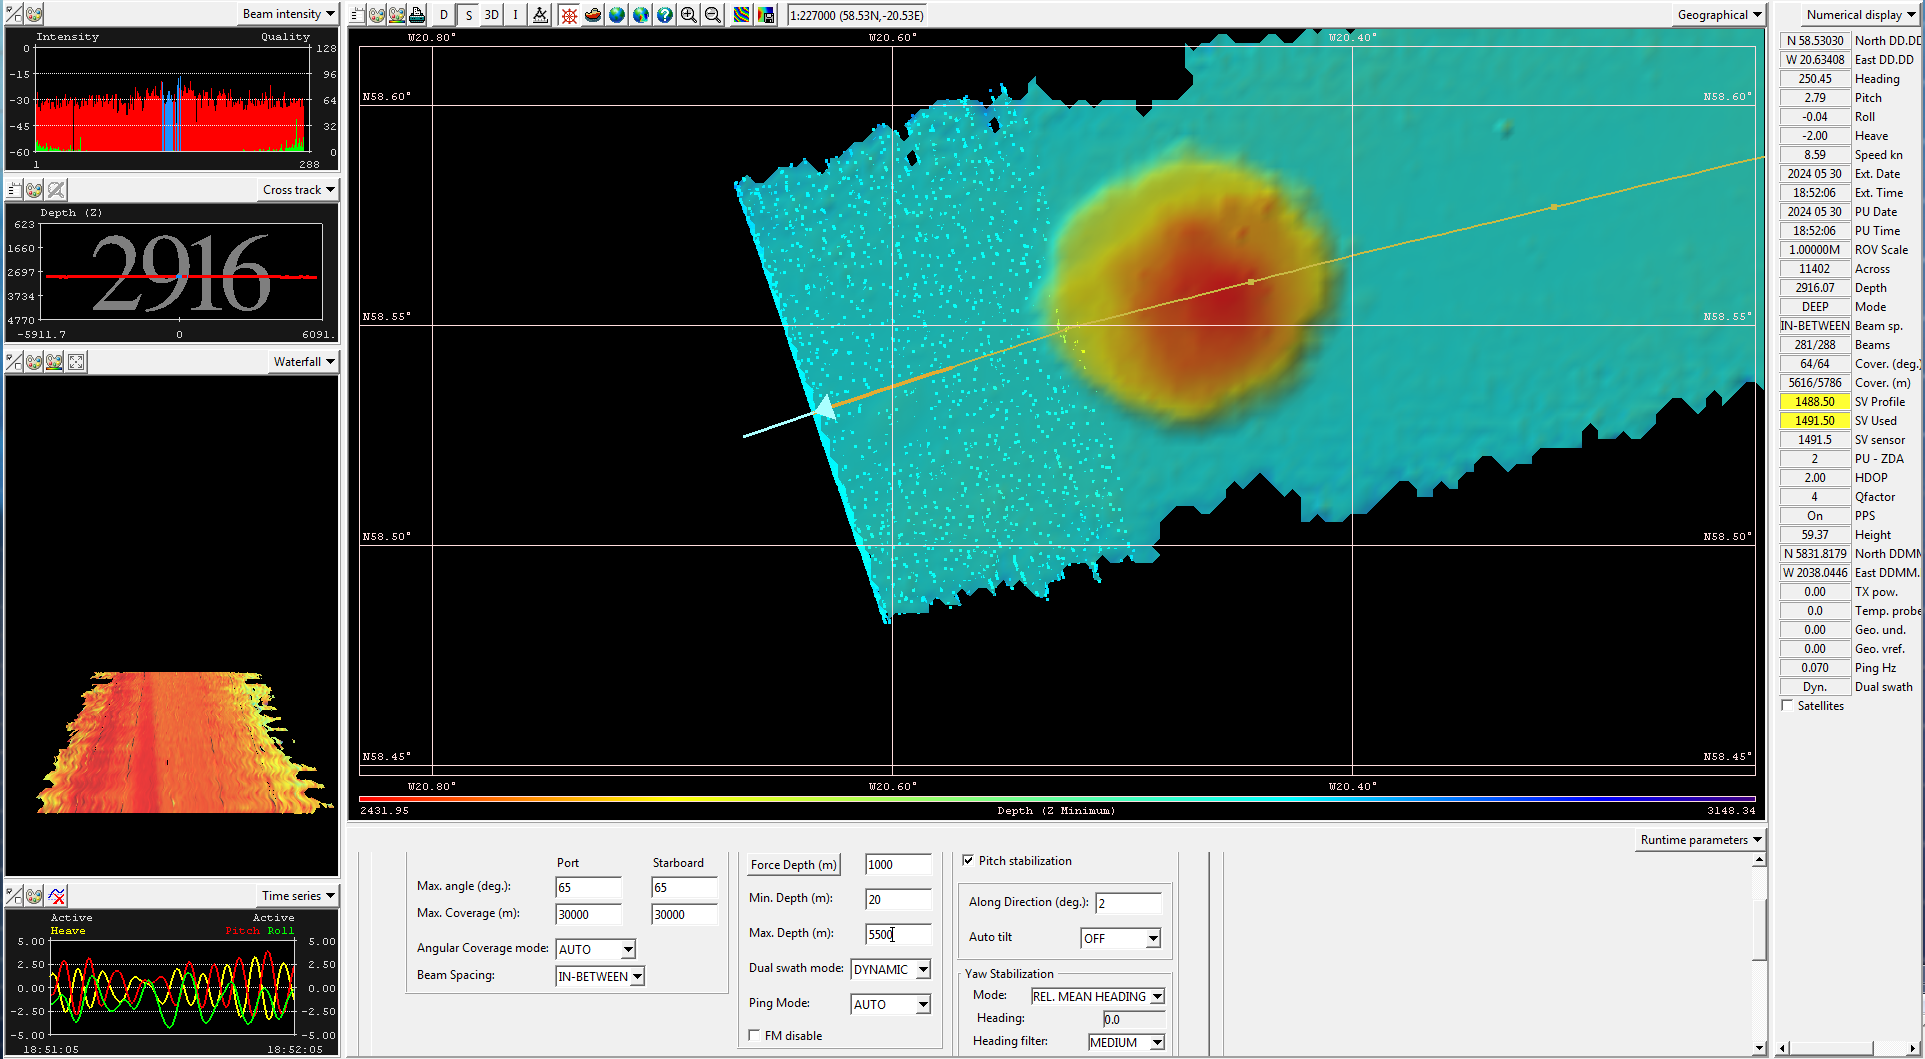
Picture of a Seamount measured during this cruise
On this trip, Daniel and Marianne from the “Underway” research data project of the German Marine Research Alliance (DAM) will take care of everything that has to do with the seamounts and the Multibeam Echo Sounder. Frequently, Multibeam data is collected even if the focus of the research is not in the measurement of the seabed. As part of the project, Daniel and Marianne worked to collect these data and make them available to scientists after the research trip. Both are part of PANGAEA, a data repository for earth and environmental data.
Sources:
- Gevorgian, J., Sandwell, D. T., Yu, Y., Kim, S.-S., & Wessel, P. (2023). Global distribution and morphology of small seamounts. Earth and Space Science, 10, e2022EA002331. https://doi.org/10.1029/2022EA002331
- Mayer, L.; Jakobsson, M.; Allen, G.; Dorschel, B.; Falconer, R.; Ferrini, V.; Lamarche, G.; Snaith, H.; Weatherall, P. The Nippon Foundation—GEBCO Seabed 2030 Project: The Quest to See the World’s Oceans Completely Mapped by 2030. Geosciences 2018, 8, 63. https://doi.org/10.3390/geosciences8020063
- Damaske, D. (2013): Bathymetry and short term changes of submarine seafloor structures in the area of the former Larsen ice shelf, north west Weddel Sea, Master thesis, http://hdl.handle.net/10013/epic.67a7bbd6-5ada-4764-a961-519e334d5c56
- https://oceanexplorer.noaa.gov/facts/seamounts.html